2025 Ricardo Water Markets Report


Background
Australian water management has undergone a significant period of reform over the past three decades. The establishment of water markets has been a key component of this reform story.
Water markets are now an established part of agricultural, urban and environmental water policy, management and investment in Australia.
The Ricardo Water Markets Report provides an overview of current water market activity in the southern Murray–Darling Basin, compares market outcomes with recent years and comments on the future outlook.
>> Click here to download the PDF version
>> Explore other Ricardo Water Markets Reports here
About Ricardo
Our Water Market Services
We are a team of award-winning, independent water markets, policy, and infrastructure advisors.
Every day, we help businesses and governments make better decisions about scarce water resources.
We do this by providing high-quality information, insights and analysis that help our clients design and implement strategies for successfully participating in Australia’s water markets. Our team also provides policy, regulatory and infrastructure advisory services.
Whether you need custom-designed water strategies or assessments of your exposure to water-related risks and opportunities, we’ll help you make clear, informed and confident water decisions.
|
Chris Olszak, Director |
Ben Williams, Associate Director |


Executive Summary
Facts at a glance 2024-25
- Estimated value of commercial allocation trade in major southern MDB trading zones: $235 million.
- Annual average southern MDB allocation prices: $115 per ML in NSW Murray (above Barmah) to $177 per ML in NSW Murrumbidgee.
- Estimated value of major southern MDB entitlement on issue (including environmental and Victorian water corporation holdings): $31.9 billion.
- Ricardo Entitlement Index (REI) 30 June 2025: 281 points (up 5.7% over 12 months).
- Value of total entitlement transfers: $771 million.
- Total volume of entitlement transfers or trades (outside of irrigation corporations): 198 GL (up 47% on 2023-24).
- Entitlement market turnover: 3%.
- Average annual high security and high reliability entitlement returns (sale of allocations): between 1.5% and 2.9%.
Summary of 2024-25
In a reversal of recent fortunes, the Ricardo Entitlement Index (REI) experienced positive growth for the first time in three years. Government buybacks largely drove the rise; this also spurred some irrigators and investors to try to get in ahead of a Commonwealth-driven price rise, in a self-fulfilling prophecy. Ricardo has identified at least 22 of the 198 GL of southern Basin trade volumes as related to Commonwealth buybacks. Dry conditions in 2024-25 led to increased activity in groundwater entitlements, marking the first annual increase since 2019-20. Allocation markets also saw the first increase in annual prices since 2018-19 as dry conditions and concerns about allocation prices in 2025-26 put continued upward pressure on prices for half of the year.
Allocation markets
- Most entitlements received their full allocation, with just an 8% reduction in water availability. Murrumbidgee general security was a notable exception.
- After three wet years, annual croppers planned for large plantings, while permanent horticulturalists worked towards securing water for 2024-25 and 2025-26.
- The additional demand combined with dry conditions and below average inflows to put upward pressure on allocation prices for most of the year.
- The annual volume weighted average price for allocations across the southern MDB was $153 per ML. Towards the end of 2024-25, markets reached as high as $300 per ML in some systems. This was driven by demand for carryover, expectations of a dry 2025-26 and sellers choosing to delay sales.
Entitlement markets
- The entitlement market was effectively a two-speed market as distressed irrigators offloaded small entitlement volumes at a discount, while the Commonwealth’s entry was a major source of upward price pressure.
- Government buybacks also drove increased market turnover, leading to the first annual increase since 2019-20.
- Northern Basin entitlement markets also experienced increased market activity and prices due to Commonwealth purchasing. This is typically an inactive market (compared to the southern MDB).
Facts at a glance – Outlook
- Comparison of 2024-25 and 2025-26 opening season allocations to consumptive users (excluding carryover): 725 GL less water allocated at opening of 2024-25.
- Estimated 2025-26 total volume of water available to southern MDB consumptive users before peak irrigation season under average inflows scenario (including carryover): approximately 4,664 GL.
- Bureau of Meteorology three-month rainfall outlook (July to September) for southern MDB: above average.
- Current (early August 2025) southern MDB allocation prices: $190 to $270 per ML.
Outlook for 2025-26
The 2025-26 water year opened with high allocations to some entitlements, but lower allocations mainly to Victorian high reliability and NSW general security entitlements. Combined with lower carryover volumes, opening and forecast peak irrigation season water availability is down from 2024-25.
The outlook for entitlement prices remains strong in the short term as the Commonwealth continues its buyback program. The two-speed entitlement market that characterised 2024-25 will likely continue in 2025-26, with the addition of buyers looking to replace entitlements that have been sold to the Commonwealth.
Allocation markets
- If current forecasts of above-average rainfall continue (early-August 2025), allocation prices could remain steady or potentially soften slightly. However, this is highly dependent on the ability of headwater storages to capture new inflows, with current forecasts of above-average rainfall more focussed outside of these storages.
- Downstream trade opportunities will likely remain limited, with the main opportunities in the Goulburn IVT (October and December) and on either side of the Murrumbidgee IVT.
Entitlement markets
- Australian agriculture remains internationally competitive from an investment and commodity standpoint, despite the confusion created by US trade tariffs. At the same time winegrape growers and dairy farmers continue to face economic challenges. Demand for high reliability and high security entitlements is expected remain strong, with buyers looking to replace entitlements sold to the Commonwealth less price sensitive than normal market participants.
- Demand for low-reliability entitlements is expected to remain strong, as accessing carryover space is a key risk management tool. General security entitlements face a mixed outlook, as a shift to drier conditions could put further downward pressure, offset by the continuation of government buybacks.
1.0. Introduction
1.1. Introduction
Now in its twelfth year, the Ricardo Water Markets Report provides water market participants, advisors, investors and policy professionals with an annual snapshot of recent water market drivers and activity in the southern connected Murray-Darling Basin (MDB) (Figure 1).
This year’s report highlights the key drivers of upward movements in water allocation prices in 2024-25 compared to the previous five years including:
- Below average rainfall and inflows create drought conditions in parts of the southern Basin.
- Reduced allocations to some entitlements and high demand for allocations, especially from annual croppers.
- Record drawdown on storages, and the potential for dry conditions to continue through 2025-26, saw upward price pressure on allocations.
We also highlight a general increase in the price for water entitlements as the Commonwealth began purchasing water in November to meet environmental targets and irrigators sought to increase their holdings to secure their water requirements.
As we look ahead from August 2025 (the time of writing), our outlook for 2025-26 explores how these factors may influence water markets in the southern MDB over the next 12 months.

Figure 1. Water trading zones in the southern Murray-Darling Basin.
Source: Ricardo, 2025.
Ricardo Entitlement Index
As Australia's only index of its kind, the Ricardo Entitlement Index (REI) provides a simple, consistent, and reliable snapshot of water entitlement performance throughout the southern MDB. The Ricardo Entitlement Index tracks the performance (capital value) of a group of major water entitlements across the southern MDB.
2024-25 marks the first time in three years the REI has increased annually, up 5.7%. This is a change from the annual 7.9% drop in 2023-24, and the smallest percentage increase since 2016-17.
The REI consistently increased across the water year, experiencing falls in only 3 months, the largest of which was in October, when it fell 1.2%. This reflects continued upward price pressure on entitlements from government buybacks, irrigators taking advantage of lower prices from previous years, and demand for carryover space.
Since its inception in 2008-09, the REI's compound annual growth rate (CAGR) has been 6.3%. However, since 2014-15, when entitlement prices began appreciating rapidly, the CAGR is 13.3%. Growth since 2019-20 has been slower at 4.7%, due to reductions in 2022-23 and 2023-24.
Ricardo’s independent water market specialists update the REI monthly using our in-house southern Murray-Darling Basin water asset valuations. The REI supports better decision-making by providing irrigators, investors, banks and other water owners with a reliable benchmark to track the capital value performance of water portfolios and investments and attract new investors.

Figure 2. Ricardo Entitlement Index, 2008-09 to 2024-25
Source: Ricardo, 2025
2.0. Market Conditions
2.1. Climatic Conditions
A tale of two halves.
Climatic conditions were very different between the northern and southern MDB. (Figure 3)
The Bureau of Meteorology (BoM) declared neutral El Niño–Southern Oscillation (ENSO) and Indian Ocean Dipole (IOD) conditions for most of 2024-25. Despite this, the southern MDB experienced below average rainfall in 2024-25.
Dry conditions were particularly prevalent in South Australia and central-western Victoria. These regions experienced their lowest annual rainfall on record. Across the year, only one month (November 2024) deviated from this trend, with rainfall totals up to 100 mm in the southern Basin.
Meanwhile, the northern MDB experienced significant rainfall for parts of the year. In March, much of the northern Basin recorded its highest rainfall on record. This helped contribute to inflows, which later found their way into the Menindee Lakes in the southern Basin. The rainfall also drove inflows into Kati Thanda-Lake Eyre in South Australia at levels not seen in at least 15 years.

Figure 3. Rainfall deciles for the Murray-Darling Basin, 1 July 2024 to 30 June 2025.
Source: Ricardo 2025. Based on Bureau of Meteorology, 2025.
2.2. Storages
Second largest storage drawdown in 25 years.
Water held in southern MDB storages fell 3,496 GL from 1 July 2024 to 30 June 2025, a reduction of 31% between the start and end of the water year (Figure 4). The in-season drawdown on storages in 2024-25 was 5,023 GL, the 2nd highest since 2000, exceeded only by 2001-02 (5,271 GL). By 30 June 2025, the volume in storages was 7,782 GL (55%). This is the fourth lowest end-of-year volume since 2015-16.
The large drawdown was caused by low inflows into storages, combined with irrigators taking advantage of favourable growing conditions and implementing large annual cropping programs, thereby increasing water demand. Dartmouth Dam, a drought reserve at the top of the Murray system, also had a 710 GL drawdown between March 1 and June 30, 2025, to support water levels in Hume Dam. A drawdown of such scale has not occurred since 2014-15 (217 GL).
Between 1 July 2024 and 31 March 2025, Menindee Lakes reduced by 476 GL (-54%). However, rainfall levels above average to the highest on record in much of the northern Basin in March and April contributed to heavy inflows downstream. As a result, between April and June, Menindee Lakes increased by 680 GL (+160%), recovering to 1,100 GL.
Compared to 1 July 2024, on 30 June 2025:
- Murray storages were 53% full (down 1,945 GL).
- Lake Eildon was 57% full (down 1,023 GL).
- Murrumbidgee storages were 46% full (down 736 GL).
- Menindee Lakes were 71% full (up 213 GL).
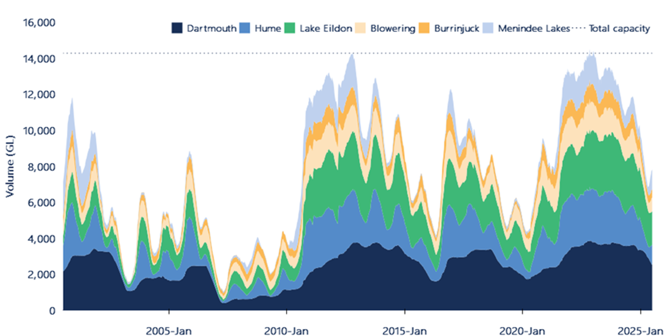
Figure 4. Volume held in storage, southern Murray-Darling Basin major headwater storages, January 2000 to June 2025.
Source: Ricardo 2025. Based on Bureau of Meteorology, 2025.
Note: Murray storages include Lake Hume and Dartmouth, Murrumbidgee storages include Blowering and Burrinjuck.
2.3. Allocations
Allocations to major southern MDB entitlements at a 5-year low.
The total volume allocated to major southern MDB entitlements in 2024-25 (including environmental water holdings) was the lowest in five years (6,058 GL), just 1% lower than the next lowest year, 2020-21 (Figure 5).
This reduction was mainly driven by reduced allocations to NSW Murrumbidgee GS, reducing total volume allocated by 1,116 GL. However, this was partly offset by carryover on general security and low reliability entitlements (see Section 2.6 Implications for the market).
Drier conditions in 2024-25 also meant that Vic Murray LRWS and Vic 1A Goulburn LRWS entitlements received no allocations.
The three-year rolling average of total water allocated to major southern MDB entitlements is now 7,283 GL (93% of total entitlement on issue). Despite reduced allocations in 2024-25, this is only the 10th lowest volume in the last 20-years since 2005-06. Allocations in 2024-25 are also still above the 20-year annual average of 5,097 GL.

Figure 5. Estimated total volume of water allocated to major water entitlements in the southern Murray-Darling Basin, 2007-08 to 2024-25.
Source: Ricardo 2025. Based on Victorian, New South Wales and South Australian water registers, 2025.
Note: Allocations to all entitlement categories are shown, including allocations to environmental water and Victorian water corporation holdings. Excludes carryover and distributions from irrigation corporations.
Full allocations to most entitlements, but later in the water year.
As discussed above, while entitlement allocations in 2024-25 were the lowest in the last five years, they are only the 10th lowest in the previous 20 years.
Most entitlements received their full allocation, although later in the water year compared to 2023-24 (Figure 6). This was especially true for NSW Murray GS, which only received full allocation in March (eight months later compared to 2023-24) (Figure 6). Similarly, Vic Murray HRWS and Vic Goulburn HRWS also received full allocation between October and December 2024, two to three months later compared to 2023-24.
NSW Murrumbidgee GS was only allocated 41% for the year, the lowest end of year allocation since 2018‑19, when it received 7%.
After receiving allocations in the last three years, drier conditions meant that Vic Murray LRWS and Vic Goulburn LRWS did not receive any allocations in 2024-25.
Overall, 6,058 GL was allocated to major southern MDB entitlements throughout 2024-25, representing 78% of the total entitlement on issue.

Figure 6. Water allocation determinations made to major southern Murray-Darling Basin entitlements, 2023-24 and 2024-25.
Source: Ricardo 2025. Based on Victorian, New South Wales and South Australian water registers, 2025.
2.4. Cropping patterns
Despite dry conditions, annual croppers make the most of water availability.
Most regions experienced below median in-crop rainfall for much of the year, with brief periods of above average rainfall on two occasions.
Dry conditions at the end of the 2023-24 water year and start of the 2024-25 water year added to drought speculation. After four relatively wet years, reduced rainfall has driven NSW to classify much of the Murray and Murrumbidgee regions as drought affected. Most of South Australia’s agricultural areas have received record-low rainfall in 2024-25.
However, relatively high-water availability meant annual croppers still sought to maximise planting areas.
Rainfall increased across much of the southern Basin between October and December, with parts of the Goulburn and Victorian lower Murray experiencing significantly above-average rain. However, this shifted into drier conditions over January and February in the summer irrigation period. Rainfall later increased in March in the Goulburn and NSW Murray, providing some relief.
NSW Murray crop producers are optimistic there was sufficient rain in June to aid germination and the initial establishment of winter crops. Meanwhile, consistent dry conditions to the end of the year is pushing farmers in South Australia away from canola, bean, chickpea and durum and towards wheat, barley and lentils.

Figure 7. Monthly observed and median rainfall in southern Murray-Darling Basin annual cropping regions, 2024-25.
Source: Ricardo 2025. Based on Bureau of Meteorology, 2025.
Note: Time period over which median rainfall is calculated varies by location. See Figure Notes.
2.5. Demand for water
Usage against major southern MDB entitlements at a 12-year high.
Total water use in major NSW and Victorian southern MDB surface water systems totalled 5,465 GL in 2024‑25, an increase of 9% from 2023-24 and the highest since 2013-14. Dry conditions, favourable commodity prices and high water availability drove annual croppers to increase plantings resulting in higher overall water demand.
In the Victorian Murray and Goulburn, usage against entitlements was the highest in a decade, up 15% from 2023-24 to 5,642 GL. This is above the 12-year average of 4,531 GL (2023-14 to 2024-25). Similarly, in the NSW Murray, usage against entitlements was up 15% from 2023-24 to 1,234 GL.
One exception was the NSW Murrumbidgee, where usage was only the fifth highest for the region since 2013-14, down 4% from 2023-24 to 1,410 GL. This was partly driven by reduced allocations to general security entitlements in 2024-25 compared to the previous year. It could have been lower, but irrigators could also access water in the Murray via the Murrumbidgee intervalley trade rule to meet their annual crop requirements.

Figure 8. Water usage in the Murrumbidgee, Murray (Victoria and NSW only) and Goulburn systems, 2018-19 to 2024-25.
Source: Ricardo 2025. Based on Victorian and New South Wales water registers, 2025.
Note: Water usage in the NSW Murrumbidgee and Murray is based on usage against HS and GS entitlements only (consumptive and environment). Water usage in the Victorian Murray and Goulburn is based on all allocation accounts with regulated trading zone sources including water shares and bulk entitlements.
2.6. Implications for the Market
Dry conditions push allocation prices to 5-year high, limited by high carryover volumes.
Despite an 8% reduction in water availability in 2024-25, the annual southern MDB allocation VWAP finished the year at $153 per ML, double that of 2023-24, but below the long-term average price ($177 per ML) (Figure 9).
Allocations in 2024-25 were 23% lower (1,791 GL) compared to 2023-24, driven by lower allocations to NSW Murrumbidgee GS and no allocations to LRWS entitlements. However, the return of all carryover volumes from spillable accounts in major northern Victorian systems reduced the fall in available water (down 739 GL instead).
While water availability was generally high, lower allocations at the start of 2024-25, combined with average-to-below-average rainfall, put some upward pressure on allocation prices. However, this pressure increased over the summer due to continuing dry conditions and above-average temperatures.
After three wet years, annual croppers looked to make the most of favourable conditions and planned for large crops. Meanwhile, permanent horticulturalists were concerned with securing water for this year and the next, especially in the lower Murray.
The increasing pressure continued towards the end of the water year as many sellers sought to hold on to their water for 2025-26 year in anticipation of lower storages and continued dry conditions. Demand for carryover contributed to rising prices towards the end of 2024-25, especially in the Goulburn and lower Murray regions.

Figure 9. Annual and monthly volume weighted average prices, and total water available to major entitlements in the southern Murray-Darling Basin (including carryover), 2007-08 to 2024-25.
Source: Ricardo 2025. Based on Victorian, New South Wales and South Australian water registers, 2025.
3.0. Allocation Markets
3.1. Allocation Trade Prices
Annual prices increase across all major allocation trading zones.
Annual allocation prices saw a significant increase compared to previous years. This year marked the largest price difference in southern MDB Volume Weighted Average Prices (VWAPs) between the start and end of the water year ($130 per ML), the largest since 2020-21 ($228 per ML). Annual prices in all major southern MDB markets increased between 89% and 159% compared to 2023-24 (Table 1).
The estimated value of total commercial trade across major southern MDB trading zones was $235 million in 2024-25, more than double the value in 2023-24 ($111 million). This is still below the peak value recorded in 2019-20 ($538 million). While there was a slight increase in volume traded this year (up from 1,468 GL to 1,521 GL), higher allocation prices drove the change in value.
Trade price trends between the Murrumbidgee and lower Murray shifted this year, with allocation VWAPs $3-$13/ML lower in the VIC and NSW lower Murray, and $9 higher in the SA lower Murray. This contrasts with previous years, where lower Murray prices were generally higher than in the Murrumbidgee by as much as $32-$59 per ML in 2021-22, encouraging downstream trade via the Murrumbidgee IVT. Lower allocations to Murrumbidgee general security entitlements in 2024-25 led to increased water demand from Murrumbidgee irrigators, which in turn drove higher Murrumbidgee prices (comparatively) and upstream trade.
|
Trading zone |
VWAP 2022-23 ($/ML) |
VWAP 2023-24 ($/ML) |
VWAP 2024-25 ($/ML) |
Change in price 2023-24 to 2024-25 (%) |
Change in price 2022-23 to 2024-25 (%) |
|
Vic 1A Greater Goulburn |
$21 |
$60 |
$112 |
89% ▲ |
426% ▲ |
|
Vic 6 Murray (Dart to Barmah) |
$18 |
$57 |
$124 |
117% ▲ |
590% ▲ |
|
Vic 7 Murray (Barmah to SA) |
$33 |
$83 |
$174 |
110% ▲ |
424% ▲ |
|
NSW Murray (above Barmah) |
$24 |
$45 |
$115 |
159% ▲ |
374% ▲ |
|
NSW Murray (below Barmah) |
$24 |
$84 |
$164 |
95% ▲ |
598% ▲ |
|
NSW Murrumbidgee |
$21 |
$83 |
$177 |
114% ▲ |
732% ▲ |
|
SA Murray |
$56 |
$95 |
$186 |
96% ▲ |
230% ▲ |
3.2. Comparison of Allocation Trade Prices
Allocation prices see a significant increase in the second half of the water year.
Allocation prices stayed relatively steady for the first five months of the water year, before dipping slightly in December from high rainfall. It then began to rise over summer and continued till the end of the year as people started securing their water needs for 2025-26 (Figure 10).
In the last week of June, the aggregated southern MDB VWAP peaked at $262 per ML. The highest weekly VWAP of any zone for the year occurred in the last week of May, in the Murray (below Barmah), at $299 per ML.
This is the first time VWAPs have increased over the year since 2018-19, despite having the highest average opening month VWAP in three years.
While all zones broadly followed the same upward trend, annual crop demand in the Murrumbidgee saw prices increase rapidly in late December and continued until March, when demand began to slow. Below-average rainfall and reduced inflows, combined with expectations of a dry 2025-26, saw sustained upward price pressure until the end of the year.
The price differential between the highest and lowest weekly VWAPs in each trading zone was:
- Combined Goulburn: up $104 per ML
- Murray (above Barmah): up $115 per ML
- Murray (below Barmah): up $182 per ML
- Murrumbidgee: up $177 per ML

Figure 10. Weekly volume weighted average prices, major southern Murray-Darling Basin trading zones, 2024-25.
Source: Ricardo, 2025. Based on Victorian, New South Wales, and South Australian water registers, 2025.

Figure 11. Weekly transfer and trade volumes (within and into), major southern Murray-Darling Basin trading zones, 2024-25.
Source: Ricardo, 2025. Based on Victorian, New South Wales, and South Australian water registers, 2025.
3.3. Allocation Trade Activity
Net trade into NSW Murrumbidgee at a five-year high.
The NSW Murrumbidgee was a net importer of allocations, the second highest of any major southern MDB zone in 2024-25 (+78 GL) and the highest for the zone since 2017-18. The SA Murray remained the largest net importer in 2024-25 (+846 GL – 2nd highest in 10 years), while Vic 7 Murray was the largest exporter (-615 GL).
The analysis in Table 2 contains all water transfers, including those recorded on water registers at $0 and other non-commercial transactions (such as environmental transfers); these can be substantial and can increase overall trade volumes. Estimates of commercial water allocation trade activity are made by excluding $0 transfers (Table 3).
Of the 198 GL transferred into the NSW Murrumbidgee in 2024-25, 51 GL was $0 environmental transfers. Excluding $0 transfers still resulted in a net import of 7.3 GL – the 2nd highest in 10 years. In the SA Murray, 725 GL of 908 GL transferred into the zone were also environmental transfers. Similar to 2023-24, 481 GL of this 725 GL occurred in September, December, March and June – likely driven by quarterly balancing requirements.
Vic 1A Greater Goulburn recorded its 2nd highest net export volume in 10 years, when including $0 trades. This reflects ongoing demand for water from the lower Murray via the Goulburn IVT (133 GL of 261 GL exported water was related party trade into the lower Murray). However, reduced water available from lower Murray sellers to carryover into the Goulburn meant it was a net exporter of priced trade for the first time since 2018-19.
|
Trading zone |
Within |
Into |
Out of |
Net change (ML) |
|||
|
No. |
Vol (ML) |
No. |
Vol (ML) |
No. |
Vol (ML) |
||
|
Vic 1A Greater Goulburn |
6,219 |
1,036,474 |
862 |
135,200 |
658 |
261,498 |
-126,299 |
|
Vic 6 Murray (Dart to Barmah) |
1,633 |
336,874 |
89 |
44,705 |
264 |
122,691 |
-77,987 |
|
Vic 7 Murray (Dart to Barmah) |
6,356 |
919,354 |
1,112 |
349,363 |
728 |
964,783 |
-615,420 |
|
NSW Murray (above Barmah) |
293 |
360,511 |
159 |
60,436 |
97 |
67,191 |
-6,755 |
|
NSW Murray (below Barmah) |
1,380 |
184,798 |
448 |
169,319 |
858 |
264,820 |
-95,501 |
|
NSW Murrumbidgee |
1,463 |
688,514 |
514 |
198,229 |
346 |
120,506 |
77,723 |
|
SA Murray |
970 |
324,998 |
567 |
908,539 |
222 |
62,916 |
845,624 |
|
Total |
18,314 |
3,851,524 |
3,751 |
1,865,791 |
3,173 |
1,864,405 |
|
|
Trading zone |
Within |
Into |
Out of |
Net change (ML) |
|||
|
No. |
Vol (ML) |
No. |
Vol (ML) |
No. |
Vol (ML) |
||
|
Vic 1A Greater Goulburn |
4,653 |
433,499 |
582 |
46,752 |
391 |
65,308 |
-18,557 |
|
Vic 6 Murray (Dart to Barmah) |
1,286 |
148,348 |
49 |
6,629 |
110 |
27,165 |
-20,536 |
|
Vic 7 Murray (Dart to Barmah) |
5,089 |
580,319 |
692 |
113,117 |
457 |
75,229 |
37,888 |
|
NSW Murray (above Barmah) |
145 |
35,916 |
107 |
26,351 |
44 |
6,259 |
20,092 |
|
NSW Murray (below Barmah) |
985 |
128,083 |
290 |
44,853 |
683 |
100,204 |
-55,351 |
|
NSW Murrumbidgee |
1,184 |
332,494 |
426 |
63,251 |
265 |
55,971 |
7,280 |
|
SA Murray |
552 |
54,317 |
376 |
63,302 |
191 |
34,461 |
28,841 |
|
Total |
13,894 |
1,712,974 |
2,522 |
364,254 |
2,141 |
364,597 |
|
3.4. Comparison of allocation market activity
Allocation markets start the year strong, before significant tightening in the second half of the year.
Markets were active over the first half of 2024-25, with volume traded or transferred up from the same period of 2023-24 in all trading zones. The first half of 2024-25 saw 287 GL (9%) more activity than the same period in 2023-24. This was mainly in the Vic Goulburn (160 GL) and NSW Murray (above Barmah) (58 GL).
The second half of the year told a different story. The market slowed with 386 GL (15%) less activity than the second half of 2023-24. Most of this reduction was in June 2025, down almost 50% from 910 GL in June 2024 to 457 GL in June 2025. This reflects a restricted supply, as those with excess water who would usually sell at this time of year instead choose to hold the water until 2025-26, expecting drier conditions.
Overall, market activity in 2024-25 was slightly lower, down 2% (-97 GL from 2023-24). An exception was in the NSW Murray (above Barmah), which was up 26% from 2023-24 to 421 GL. Market activity was relatively steady for Vic 7 Murray (1,269 GL – down 4%) and SA Murray (1,234 GL - down 1%).

Figure 12. Monthly volume weighted average prices, and transfer and trade volumes (within and into), major southern Murray-Darling Basin trading zones, 2023-24 to 2024-25.
Source: Ricardo, 2025. Based on Victorian, New South Wales, and South Australian water registers, 2025.
3.5. Trade constraints
Another year of limited trade opportunities.
Trade constraints limit moving water allocations between southern MDB markets. This can alter water supply and demand dynamics within and between regions, driving price differences between trading zones.
The Goulburn IVT, as prescribed by the Goulburn to Murray trade rule, had three openings in 2024-25, totalling:
- 1 July: 85 GL (59 GL in 2023-24)
- 14 November (postponed from October): 45 GL (90 GL in 2023-24)
- 15 December: 9 GL (12 GL in 2023-24)
From 15 December onwards, trade across the IVT is only allowed when backtrade between the Murray and Goulburn occurs. However, lower supply in allocation markets and upward price pressure in the lower Murray meant the IVT was mostly closed after 15 December.
The opening trade opportunity for the Barmah Choke on 1 July 2024 was 56 GL (61 GL on 1 July 2023). This was the first opening where NSW and Victoria have co-operated, interleaving applications to improve equitable access to the trade opportunity. Trade was largely closed via the Choke for the rest of the year.
The largest weekly price differential between zones separated by IVTs were:
- Goulburn to Lower Murray (Goulburn IVT): $132
- Upper Murray to Lower Murray (Barmah Choke): $128
- Murrumbidgee to Lower Murray (Murrumbidgee IVT): $83

Figure 13. Upstream to downstream trade opportunities (end-of-day) during 2024-25 with weekly allocation volume weighted average prices showing price divergence and equalisation.
Source: Ricardo, 2025. Based on Victorian and New South Wales water registers, 2025. MDBA 2025, Victorian Water Register 2025.
3.6. Reasons for Trade
Consistent trade breakdown compared to previous years.
Across NSW, Victoria and SA, a purpose was listed for 99% of priced commercial trade volumes (2023-24: 99%) and 97% of $0 trade volumes (2023-24: 97%). Figure 14 shows the monthly volume of priced and $0 allocation transfers or trades by reason.
Trade with a reported purpose of “Other” constituted 20% of the $0 volume traded or transferred, totalling 279 GL in July, and 515 GL for 2024-25.
The priced trade volume in 2024-25 was comprised of:
- 76% standard commercial trade (77% last year),
- 13% delivery of allocations under forward contracts and entitlement leases (10% last year),
- 8% Carryover parking return (10% last year).
The $0 trade volume in 2024-25 was comprised of:
- 45% related party trade (35% last year),
- 42% environmental use and other trade (32% last year),
- 8% carryover parking return (3% last year).
This is now the second year that all three Basin states are reporting trade purposes. The data to date show that it would be helpful if there were more consistency between the three states. We expect the information provided in future years to continue helping market participants better understand the nature of individual trades.

Figure 14. Volume traded by purpose of trade in major southern MDB trading zones, 2024-25.
Source: Ricardo, 2025. Based on Victorian and New South Wales water registers, 2025.
Note: Data includes trades and transfers into and within NSW Murray (above Barmah), NSW Murray (below Barmah), NSW Murrumbidgee, Vic 1A Greater Goulburn, Vic 6 Murray (Dart to Barmah) and Vic 7 Murray (Barmah to SA). Data excludes irrigation corporation trade and transfers.
Note: Victoria uses 8 categories; NSW uses 12, and SA uses 6 categories. All categories are reported.
3.7. Allocation trade activity in the Murray (above the Barmah Choke)
Murray (above Barmah Choke) allocation trade activity decreased by 10% compared to 2023-24.
Data for water market trade activity in irrigation corporations is essential. It enables market participants to build a more complete picture of trade activity compared with just state water register data.
Although data on irrigation corporation trade activity is limited, Murray Irrigation Limited provide aggregated daily water allocation sales data on its website. Building on the data from the last three water years, Ricardo combined this information with data from the NSW and Victorian water registers to illustrate the events in the upper Murray in 2024-25.
The total volume traded in the upper Murray in 2024‑25 was 449 GL, a 10% decrease on the 498 GL traded in 2023-24 and a 51% increase on the 298 GL traded in 2022-23. Trade activity peaked in February, when the total volume traded or transferred was ~58 GL.
Trading volumes decreased towards the end of the year, with 29 GL in June 2025 (63 GL in June 2024). This reflected a restricted supply, with sellers choosing to hold their water until 2025-26 in anticipation of dry conditions.

Figure 15. Monthly allocation transfer and trade volumes, NSW and Victorian Murray (above Barmah) 2024-25.
Source: Ricardo, 2025. Based on NSW and Victorian water registers. Murray Irrigation Limited website, 2025.
Note: Volumes from the NSW and Victorian water registers include all volumes transferred or traded (within and into zones 6 and 10).
4.0. Entitlement Markets
4.1. Entitlement trade prices
A two-speed market.
The entitlement market was effectively a "two-speed" market, characterised by differing motivations. On one hand, smaller sellers, often wine grape growers, found themselves selling small entitlement volumes at below-maket prices to manage immediate financial pressures, such as reducing debt or securing short-term cash flow.
In contrast, larger sellers (typically also more financially resilient) opted to hold off in anticipation of the Commonwealth's entry into the market. This meant that any volumes they brought to the spot market were priced at the level they believed the Commonwealth would pay.
In November, the Commonwealth began purchasing entitlements, which significantly contributed to rising price pressures in the market. This was especially evident for Vic 1A Goulburn HRWS, where Duxton's sale to the Commonwealth accounts for over 30% of the total volume traded for the year, sold at a 21% premium to the annual volume-weighted average price (VWAP) for 2023-24.
In the second half of the year, there was significant price pressure on high-security entitlements, particularly for Vic 7 Murray HRWS and SA Murray HS. Despite the increased demand and competition, the annual price change figures do not fully capture this recent upward trend.
|
|
No. traded 2024-25 |
Volume traded (ML) 2024-25 |
Annual VWAP ($/ML) |
Annual change in price (%) |
Change in price 2022-23 to 2024-25 (%) |
|
|
2023-24 |
2024-25 |
|||||
|
Vic 1A Greater Goulburn HRWS |
705 |
38,766 |
$3,973 |
$4,336 |
9.1% ▲ |
5% ▲ |
|
Vic 1A Greater Goulburn LRWS |
357 |
21,015 |
$880 |
$969 |
10% ▲ |
11% ▲ |
|
Vic 6 Murray (Dart to Barmah) HRWS |
169 |
8,238 |
$4,569 |
$4,309 |
-6% ▼ |
-14% ▼ |
|
Vic 6 Murray (Dart to Barmah) LRWS |
109 |
5,601 |
$803 |
$965 |
20% ▲ |
14% ▲ |
|
Vic 7 Murray (Barmah to SA) HRWS |
634 |
21,173 |
$7,126 |
$7,043 |
-1% ▼ |
-10% ▼ |
|
Vic 7 Murray (Barmah to SA) LRWS |
152 |
10,356 |
$1,878 |
$2,157 |
15% ▲ |
19% ▲ |
|
NSW Murray 10 GS |
26 |
26,834 |
$1,760 |
$1,911 |
9% ▲ |
16% ▲ |
|
NSW Murray 10 HS |
0(1) |
0(1) |
$7,365 |
$0(1) |
-100%(1) ▼ |
-100%(1) ▼ |
|
NSW Murray 11 GS |
64 |
9,863 |
$2,873 |
$3,067 |
7% ▲ |
11% ▲ |
|
NSW Murray 11 HS |
54 |
7,252 |
$9,068 |
$9,022 |
-1% ▼ |
-4% ▼ |
|
NSW Murrumbidgee GS |
49 |
32,514 |
$2,463 |
$3,049 |
24% ▲ |
17% ▲ |
|
NSW Murrumbidgee HS |
26 |
6,435 |
$8,745 |
$8,645 |
-1% ▼ |
-5% ▼ |
|
SA Murray HS |
181 |
9,737 |
$7,259 |
$7,046 |
-3% ▼ |
-15% ▼ |
|
Total |
2,526 |
197,783 |
|
|
|
|
Note: Volume weighted average prices generated from state water register trade data may differ from market values. Note that NSW 71M trades are not included in these figures. See notes section for further details.
4.2. Comparison of trade prices and volume
High reliability and high security entitlements.
Monthly register VWAPs between July 2024 and June 2025 saw a mixed trend across HRWS and HS entitlements. These are based on state water register data, which can often lag market prices. Water register data also includes buyback trades, which can increase prices for some entitlements (NSW Murray 11 HS in May). This can make it challenging to understand prices fully. Market activity was overall lower than 2023-24 (down 9%) (Figure 16) – noting this excludes NSW Transfer 71M trades (combined land and water transactions).
There were mixed results for monthly VWAPs across HRWS and HS entitlements between July 2024 and June 2025. The largest falls were for NSW Murray 11 HS (down 6%) and Vic 1A Goulburn HRWS (down 4%). Meanwhile, Vic 7 Murray HRWS and SA Murray HS increased 10%.
Monthly VWAPs for Vic 6 Murray HRWS remained steady at ~$4,300 per ML in 2024-25.
In the southern MDB, entitlement trading volume increased by 8 GL, or 9%, compared to 2023-24. Notably, Victoria's 1A Goulburn HRWS rose by 8.5 GL (28%), and Murray HRWS increased by 2.2 GL (12%). In contrast, NSW Murray 11 HS entitlements declined by 3.9 GL (35%), and SA Murray HS dropped by 3.2 GL (25%).

Figure 16. Monthly volume weighted average prices and transfer volumes (within and into), major southern Murray-Darling Basin high reliability and high security entitlements, 2023-24 to 2024-25.
Source: Ricardo, 2025. Based on Victorian, New South Wales and South Australian water registers, 2025.
Note: Excludes Transfer 71M trades (combined land and water transactions) on the NSW Water Register.
Low reliability and general security entitlements.
Monthly register VWAPs for LRWS and GS entitlements between July 2024 and June 2025 were relatively steady or increased, except NSW Murray 10 GS. These are based on state water register data, which can often lag market prices. Water register data also includes buyback trades, which in most cases increased prices (NSW Murray 11 GS in May and NSW Murrumbidgee GS in June). This can make it difficult to fully understand prices.
NSW Murrumbidgee GS VWAP had the largest increase, up 23%, followed by Vic 1A Goulburn LRWS (up 12%), and Vic 7 Murray LRWS (up 7%). NSW Murray 11 GS stayed relatively steady, decreasing by just 1% ($17). Vic 6 Murray prices had a slight drop mid-year before increasing till June – driven by government buybacks.
The upward price pressure on entitlements reflects government buybacks and ongoing interest in securing carryover space, particularly in the lower Murray and Goulburn regions.
Trade and transfer activity for LRWS and GS entitlements increased across all major southern Basin zones. Total volumes almost doubled from 51 GL in 2023-24 to 106 GL in 2024-25. Half of this increase was driven by NSW Murray 10 GS, which increased by 25 GL between years. The next largest increase was NSW Murrumbidgee GS (up 14 GL).

Figure 17. Monthly volume weighted average prices and transfer volumes (within and into), major southern Murray-Darling Basin low reliability and general security entitlements, 2023-24 to 2024-25.
Source: Ricardo, 2025. Based on Victorian, New South Wales and South Australian water registers, 2025.
Note: Price axes differ across the charts above, reflecting the general price differences between entitlements. Excludes Transfer 71M trades (combined land and water transactions) on the NSW Water Register.
4.3. Total entitlement market size and value
The value of southern MDB entitlements rose 5% to a near-record of $32 billion.
The most active water entitlement markets in Australia are in the southern MDB. In 2024-25, the estimated total value of major entitlements on issue in the southern MDB rose 5% or $1.5 billion from 2023-24 ($30.4 billion) – the 2nd highest since 2013-14.
The estimated market value for 2024-25 was approximately $31.9 billion (Table 5). This estimate is based on state water register data, which often lags behind market prices. The REI considers current market data and shows a recovery market, with a 5.7% increase in value.
With total entitlement on issue largely unchanged in 2024-25, 73% of the increase was driven by higher annual VWAPs for NSW Murrumbidgee GS, which also has the highest volume on issue. Higher annual entitlement VWAPs for Vic Goulburn HRWS drove 24% of the increase, with much of it attributed to several buyback trades as part of a single transaction totalling approximately 14 GL, at a ~20% premium.
The increase in entitlement values from 2023-24 follows a decrease from the previous year (-6%). This reflects upward price pressure from government buybacks.
The estimated value of environmental water holdings in the southern MDB increased by 4% from 2023-24 to $8.3 billion. However, at the time of writing, not all Commonwealth purchases have been registered.
|
Entitlement type |
Total entitlement on issue (ML) |
Environmental held entitlements (ML) |
VWAP ($/ML) 2024-25 |
Estimated value of entitlements on issue (million) |
Estimated value of environmental entitlements (million) |
|
Vic 1A Greater Goulburn HRWS |
1,010,050 |
302,160 |
$4,336 |
$4,379 |
$1,310 |
|
Vic 1A Greater Goulburn LRWS |
443,320 |
49,090 |
$969 |
$430 |
$48 |
|
Vic 6 Murray (Dart to Barmah) HRWS |
326,770 |
117,340 |
$4,309 |
$1,408 |
$506 |
|
Vic 6 Murray (Dart to Barmah) LRWS |
135,510 |
18,180 |
$965 |
$131 |
$18 |
|
Vic 7 Murray (Barmah to SA) HRWS |
945,690 |
268,030 |
$7,043 |
$6,660 |
$1,888 |
|
Vic 7 Murray (Barmah to SA) LRWS |
184,750 |
23,390 |
$2,157 |
$398 |
$50 |
|
NSW Murray 10 GS |
1,301,236 |
377,038 |
$1,911 |
$2,487 |
$699 |
|
NSW Murray 10 HS |
22,811 |
4,499 |
$7,475 |
$171 |
$34 |
|
NSW Murray 11 GS |
372,860 |
126,279 |
$3,067 |
$1,144 |
$387 |
|
NSW Murray 11 HS |
166,894 |
21,623 |
$9,022 |
$1,506 |
$195 |
|
NSW Murrumbidgee GS |
1,892,005 |
497,528 |
$3,049 |
$5,769 |
$1,517 |
|
NSW Murrumbidgee HS |
364,426 |
17,113 |
$8,645 |
$3,150 |
$148 |
|
SA Murray HS |
608,000 |
207,000 |
$7,046 |
$4,284 |
$1,459 |
|
Total |
7,774,321 |
2,029,270 |
|
$31,917 |
$8,279 |
Source: Ricardo, 2025. Based on Victorian, New South Wales and South Australian water registers, 2025.
Note: Volume weighted average prices were generated using data reported on the state-based water registers; market values may differ. An exception was NSW Murray 10 HS whose VWAP is based on Ricardo’s estimated average monthly Fair Market Unit Value in 2024-25
Note: In reports prior to 2019-20, Ricardo reported the estimated value of environmental holdings based on Commonwealth environmental purchases only. For the last two years, Ricardo has used an estimate of the environmental entitlement on issue for major entitlements in the southern MDB. See Table Notes section for further details about data sources.
4.4. Entitlement market turnover and returns
Commonwealth buybacks drive increased market turnover for the first time in five years.
Market turnover is the volume traded or transferred as a proportion of the estimated consumptive entitlement on issue. For major entitlements in the southern MDB, market turnover in 2024-25 varied between 1.8% and 6.4% (average of 3%) (Table 6).
From the record low of 135 GL in 2023-24, the total volume traded or transferred increased by 47% to 198 GL, the first annual increase since 2019-20.
Commonwealth purchasing towards Basin Plan targets drove the increase in turnover. This is especially the case for Vic Goulburn HRWS, NSW 10 Murray GS and NSW Murrumbidgee GS (up 12-78% from 2023-24). At the time of writing, Ricardo has identified at least 22 GL of southern MDB buyback trades in 2024-25.
The market turnover value for major southern MDB entitlements in 2024-25 was around $771 million (Table 6). This represents a 28% increase on 2023-24, driven by the combination of higher volumes and entitlement prices.
Despite higher entitlement VWAPs, higher allocation prices in 2024-25 resulted in returns to all entitlements in 2024-25 being higher than in 2023-24 (except for NSW Murrumbidgee GS).
|
Entitlement type |
No. traded |
Volume traded (ML) |
Estimated turnover value (million) |
Estimated turnover (%) |
Average annual gross return (%) |
|
Vic 1A Greater Goulburn HRWS |
705 |
38,766 |
$168 |
5% |
2.6% |
|
Vic 1A Greater Goulburn LRWS |
357 |
21,015 |
$20 |
5% |
No allocation |
|
Vic 6 Murray (Dart to Barmah) HRWS |
169 |
8,238 |
$35 |
4% |
2.9% |
|
Vic 6 Murray (Dart to Barmah) LRWS |
109 |
5,601 |
$5 |
5% |
No allocation |
|
Vic 7 Murray (Barmah to SA) HRWS |
634 |
21,173 |
$149 |
3% |
2.5% |
|
Vic 7 Murray (Barmah to SA) LRWS |
152 |
10,356 |
$22 |
6% |
No allocation |
|
NSW Murray 10 GS |
26 |
26,834 |
$51 |
2.9% |
6.6% |
|
NSW Murray 10 HS |
0 |
0 |
$0 |
0% |
1.5% |
|
NSW Murray 11 GS |
64 |
9,863 |
$30 |
3.9% |
5.9% |
|
NSW Murray 11 HS |
54 |
7,252 |
$65 |
5% |
1.8% |
|
NSW Murrumbidgee GS |
49 |
32,514 |
$99 |
2% |
2.4% |
|
NSW Murrumbidgee HS |
26 |
6,435 |
$56 |
2% |
1.9% |
|
SA Murray HS |
181 |
9,737 |
$69 |
2% |
2.6% |
|
Total |
2,526 |
197,783 |
$771 |
3% |
|
Source: Ricardo, 2025. Based on Victorian, New South Wales and South Australian water registers, 2025.
Note: Volume weighted average prices were generated using data reported on the state-based water registers; market values may differ. An exception was NSW Murray 10 HS whose VWAP is based on Ricardo’s estimated average monthly Fair Market Unit Value in 2024-25. While there were no recorded trades in 2024-25, the gross return is based on our estimated Fair Market Unit Value.
4.5. Groundwater markets
Groundwater markets start picking up.
Groundwater markets saw increased activity in 2024‑25, the first annual increase since 2019-20. Drier conditions in 2024-25 led irrigators to mitigate water security risks. Groundwater offers a more secure water supply than surface water but usually has higher pumping costs.
Eleven priced entitlement trades totalling 3.3 GL were recorded in major groundwater zones (Lower Lachlan, Lower Murrumbidgee and Lower Murray), up from seven trades (1.8 GL) in 2023-24. This is still well below the peak of 7.5 GL of priced trades in 2021‑22.
Similarly, the volume traded or transferred (including $0 trades) in 2024-25 was 4.5 GL, up from 2.7 GL in 2023‑24, but below the peak of 11.6 GL in 2019‑20.
Between 2023‑24 and 2024‑25, annual VWAPs for:
- Lower Murrumbidgee Deep Groundwater decreased by 9% from $4,062 per ML to $3,706 per ML (although this is an aggregate of three zones)
- Lower Murray Groundwater decreased by 4% from $2,456 per ML to $2,350 per ML
- Lower Lachlan Groundwater saw the first recorded trades since April 2022, with an annual VWAP of $3,700 per ML.

Figure 18. Individual water entitlement trades (priced trades only, $0 trades excluded) and volumes (bubble size), major groundwater entitlement markets, 2012-13 to 2024-25.
Source: Ricardo, 2025. Based on New South Wales Water Register, 2025.
Note: NSW Lower Murrumbidgee Deep Groundwater Source Aquifer is an aggregate of the three zones in this aquifer. This reflects the way in which trades for these entitlements are recorded on the NSW Water Register.
4.6. Northern MDB markets
Northern Basin market activity increasing – driven by Commonwealth buybacks.
Northern Basin market activity rose for the second year in a row in 2024-25, up 12% from 2023-24 to 11.3 GL. The key driver was Commonwealth water recovery towards Basin Plan targets. Due to limited connectivity and trades usually associated with land transfers, trade activity for northern Basin entitlements is generally lower than that of their southern Basin counterparts. Standalone entitlement trades in major northern MDB markets are shown in Figure 19.
With 46 trades processed in major northern markets in 2024-25, understanding current market prices via VWAPs can be challenging. However, key movements in 2024-25 included:
- NSW Macquarie and Cudgegong GS increased 81% from $2,216 per ML to $4,019 per ML. However the 2023-24 VWAP was driven by a one-off $1,500 trade.
- NSW Lower Namoi GS increased 27% from $9,703 per ML to $12,326 per ML, (total volume traded at 1.8 GL). Ricardo analysis indicates Commonwealth water purchases continue inflating this price, with 1.5 GL of trade recorded at $11,622 per ML.
- NSW Lachlan GS was an exception, down 14% from $1,952 per ML to $1,682 per ML. However, the 2023-24 VWAP was inflated by recorded Commonwealth purchases based on Ricardo’s analysis

Figure 19 Individual water entitlement trades (priced trades only, $0 trades excluded) and volumes (bubble size) for active northern Murray-Darling Basin entitlement markets, 2013-14 to 2024-25.
Source: Ricardo, 2025. Based on New South Wales Water Register, 2025.
Note: Data based on 71Q licence-to-licence transfers, which tend to be unrelated to land transfers.
Note: No priced trades were recorded on the NSW Water Register for: 1) NSW Lower Lachlan GS in 2021-22 and 2022-23; and 2) for NSW Gwydir GS in 2021-22 and 2022-23.
Note: Six NSW Namoi GS entitlement trades were recorded in 2023-24 at $6,350 (39 ML), $9,913 (945 ML), $9,913 (43.5 ML), $8,500 (33 ML), $8,500 (68 ML) and $9,913 (213 ML) but due to axis constraints, are not included.
Note: Eight NSW Namoi GS entitlements trades were recorded in 2024-25 at $13,000 (276 ML, 1,215 ML), $6,000 (3 ML), $8,250 (100 ML), $8,100 (21.5 ML), $10,000 (62 ML and 138 ML) and $8,500 (5 ML). Due to axis constraints there are not included.
5.0. Policy & Management
5.1. The year in water policy and management
The 2024-25 water year marked the push towards delivering the Basin Plan, with the release of tenders for the recovery towards the 450 GL additional water for the environment, and closure of the remaining Bridging the Gap surface water target.
The Restoring Our Rivers Act 2023 extended deadlines and lifted the purchase cap
The Restoring Our Rivers Act 2023 (ROR Act) introduced legislative changes that enable the full implementation of the Basin Plan, including the extension of delivery timelines and the removal of the 1,500 GL cap on Commonwealth water purchases. This has enabled the government to enter the market and initiate the tender process for the full recovery of the Basin Plan.
Legislative amendments extended timeframes for delivery on the Plan included:
- SDLAM supply projects have been extended to 31 December 2026.
- Additional time for new SDLAM projects to be proposed by June 2025.
- Delivery of the Basin Plan, including 450 GL additional water by 31 December 2027.
Recovery Targets
In July 2024, the Government released their Trading Strategy, Framework to deliver the Basin Plan in Full, and Addendum to the Basin Plan Regulation Impact Statement, to enable delivery of the Restoring Our Rivers Act recovery targets.
There are three key recovery targets under the Basin Plan;
Bridging the Gap
A Basin-wide target for purchases to recover water to ‘bridge the gap’ between historic water overuse and a sustainable level of use. The 2018 Basin Plan Amendment reduced this target from 2,750 GL/y to 2,075 GL/y.
The Bridging the Gap target is broken down into local targets, known as Sustainable Diversion Limit (SDL) resource units, with 29 surface water and 80 groundwater across targets in the Murray-Darling Basin.
Each SDL resource unit has a local target and a shared target, which contribute towards the full 2,075 GL/y recovery target. The Commonwealth is in the process of balancing these targets and ensuring full recovery is met.
450 GL additional water for the environment
Focused on the southern Basin, the 450 GL/y additional environmental water target seeks to achieve enhanced environmental outcomes while minimising socio-economic impacts. This was an in-principle agreement as part of the 2018 amendments to the Basin Plan, with the ROR Act 2023 expanding its scope of recovery methods to include voluntary water purchases, infrastructure projects, and changes to water management rules.
After reconciliation of the Bridging the Gap recovery volumes, 79.6 GL of over-recovered water has been credited towards the target as of March 2025.
Sustainable Diversion Limit Adjustment Mechanism (SDLAM) target
Also focused on the southern Basin, SDLAM projects aim to achieve equivalent environmental outcomes while using less water, thereby reducing the amount of water taken from the consumptive pool for recovery. This is to be achieved through supply and constraint projects throughout NSW, Vic, and SA.
The 2023-24 MDBA Annual Report Card notes that as of June 2024, 13 projects are complete and operational, 10 are likely to be delivered in full by 31 December 2026, and four likely to be delivered in part by 31 December 2026. The remaining eight are unlikely to be delivered by the 2026 deadline.
The 2023 MDBA Assurance Report estimates a shortfall of between 190‑314 GL/y against the SDLAM target, which is to be determined after reconciliation. The report indicates that the higher end of the range is more likely. The Commonwealth is obligated to recover the full SDLAM target under Basin Plan legislation, meaning that once the final shortfall has been reconciled, there is potential for the need to open new tender programs for water purchases or for the Commonwealth to enact a mandatory SDL adjustment.
|
|
Water recovery target |
Progress towards target |
Remaining recovery |
|
‘Bridging the Gap’ surface water |
2,075.0 GL |
2,068.9 GL |
6.7 GL* |
|
‘Bridging the Gap’ groundwater |
38.45 GL |
35.25 GL |
3.2 GL |
|
450 GL for enhanced environmental outcomes |
450.0 GL |
157.3 GL*** |
292.7 GL |
|
SDLAM projects |
605 GL |
291 - 415 GL |
190 GL - 314 GL ** |
* The remaining target is to be recovered from the northern Basin, including 3.82 GL/y in the NSW Border Rivers, and 1.28 GL/y in the Barwon-Darling.
** The most recent MDBA assurance report estimates that, as of July 2023, there is likely to be a shortfall in the recovery targets of between 190 and 314 GL, once reconciliation is undertaken. The report indicates that the shortfall is likely to be at the higher end of this range.
*** Includes 79.6 GL of over-recovered entitlement based on local targets, and 53.2 GL/y of water contracted but not yet registered.
2024-25 Tender Programs
In 2024, the Commonwealth launched several Expression of Interest (EOI) and tender programs to meet the recovery targets ahead of the revised delivery dates.
|
Tender Program |
Total to be recovered |
Dates |
|
Bridging the Gap Target |
||
|
Bridging the Gap 2024 |
13.57 GL/y surface water:
|
Open: 18 September 24 Closed: 13 November 24 |
|
450 GL additional environmental water |
||
|
Restoring our Rivers Selected Catchments tender |
70 GL/y surface water |
Open: 15 July 24 Closed: 11 September 24 |
|
EOI 1 - remaining southern connected Basin |
Not defined |
Open: 30 September 24 Closed: 27 November 24 |
|
EOI 2 - large portfolios of water in the southern connected Basin
|
Not defined |
Open: 30 September 24 Closed: 27 November 24 |
Source: Ricardo 2025.
450 GL/y Tender Outcomes
The Commonwealth announced that as of July 2025, they have recovered 157.3 GL towards the 450 GL target, with another 129.3 GL planned to be recovered by the end of 2025. This plan includes 7.8 GL of water savings infrastructure projects, 19.9 GL accepted offers through Selected Catchments tender that has not yet been contracted, and up at an additional 101.6 GL through current ongoing voluntary water purchase activities.
Since the opening of the Restoring Our Rivers Selected Catchments tender – a 70 GL tender - Ricardo has identified that the Commonwealth has signed 137 contracts with 103 unique suppliers, with the contract values totalling $123.3 million.
Ricardo has been able to match 74% of these contracts to the corresponding 102 trades on state water registers. These trades total over 24.4 GL, with a total contract value of over $88 million across the four catchments. It can be noted that there have been no matched trades in the Ovens catchment, nor have the Commonwealth reported any accepted offers or contracts.
Table 9. Identified trades from the 70 GL/y tender
|
Zone |
Total Volume (ML) |
Total Contract $ |
VWAP |
|
NSW Murray 10 GS |
2,040 |
$4,633,632 |
$2,271 |
|
NSW Murray 11 GS |
5,758 |
$18,804,827 |
$3,266 |
|
NSW Murray 11 HS |
1,882 |
$20,090,865 |
$10,675 |
|
NSW Murrumbidgee GS |
10,014 |
$31,985,147 |
$3,194 |
|
NSW Murrumbidgee Supplementary Water |
1,115 |
$1,279,602 |
$1,148 |
|
SA Murray HS** |
385 |
$2,768,900 |
$7,192 |
|
Vic 6 Murray (Dart to Barmah) HRWS |
336 |
$1,522,685 |
$4,529 |
|
Vic 6 Murray (Dart to Barmah) LRWS |
1,583 |
$1,854,473 |
$1,172 |
|
Vic 7 Murray (Barmah to SA) HRWS |
350 |
$2,605,012 |
$7,449 |
|
Vic 7 Murray (Barmah to SA) LRWS |
1,025 |
$2,529,480 |
$2,468 |
|
Total |
24,487 |
$88,074,623 |
|
Source: Ricardo 2025. Based on Victorian, New South Wales, and South Australian water registers, 2025.
*Because of Commonwealth reporting obligations to minimise market manipulation, it is difficult to match everything with 100% accuracy. Based on available information on AusTender and state water registers, Ricardo has matched these trades to executed contracts to their best of our ability.
** SA has been the only state to provided government buybacks as a reason for trade.

Figure 20. Share of volume purchased by state in the 70GL/y tender.
Source: Ricardo 2025. Based on Victorian, New South Wales, and South Australian water registers, 2025.

Figure 21. Share of volume purchased by state in the 70GL/y tender.
Source: Ricardo 2025. Based on Victorian, New South Wales, and South Australian water registers, 2025.
Figure 20 shows that of the total EOI available in the four catchments where purchases have been made for the 70 GL/y tender, the tender entitlements currently only account for 0.3%. However, the total share of held environmental water (HEW) within these systems accounts for 33% of total EOI.
With the EOI 1 and EOI 2 still in progress, and both focused on the southern Murray Darling Basin, to achieve the full 450 GL target, the proportion of HEW in these catchments is highly likely to increase.
Figure 21 highlights the proportional success of the 70 GL/y tender in purchasing entitlements in NSW compared to Vic and SA. NSW accounts for 85% of identified purchases from the tender, amounting to 20,718 ML, compared to Vic with 13% for 3,323 ML, and SA with only 2% for 385 ML.

Proportionally, the majority of the entitlements purchased have been GS / LRWS, accounting for 85% of purchased entitlements, with HS / HRWS accounting for 5%, and supplementary water accounting for the remaining 12%.
This could be indicative of the types of entitlements that have been offered to the Commonwealth through the tender, or that the Value for Money framework rates these entitlements higher, making them more likely to be purchased.
With a remaining target of 292.7 GL/y (as at 31 March 2025, as officially documented) towards the 450 GL/y target, the Commonwealth is likely to continue these purchase programs in line with the Portfolio Budget Statement 2025-26. This outlines the planned performance to procure 100 GL each financial year, until the total is met by 31 December 2027, to be achieved through both the purchase programs and the Resilient Rivers Program.
Beyond the 70 GL/y tender, the only successful contract reported from EOI 2 (large parcels) was a $121.3 million sale from Duxton Capital. Duxton reported this sale to the market, stating that it consisted of:
- 3,101 ML HS entitlements in NSW.
- 13,114 ML HRWS in Vic.
- 14,419 ML GS in NSW.
No further trades have been lodged on AusTender for the EOI 1 or 2 processes.
Future Tender Programs
While the Commonwealth have not yet announced any future tenders, their trading strategy and the Budget papers suggest they are seeking to acquire 100 GL/y over the forward estimates until the full 450 GL has been recovered.
Beyond the 450 GL, there remains a possibility that the government will initiate a tender process to address the 605 GL SDLAM shortfall once reconciliation has been finalised and the shortfall confirmed.
The re-election of the Commonwealth Labor Government means that the current Commonwealth water policy is unlikely to change substantively; however, with a change of Minister, there may be some variation. Nevertheless, the forecast budget deficits may impact funding for future water purchase programs. While the government remains committed to delivering the Basin Plan in full, constrained fiscal conditions may necessitate a more pragmatic and cost-effective approach.
AWEP Purchases
The Aboriginal Water Entitlements Program (AWEP) is a $100 million initiative aimed at purchasing water entitlements for First Nations peoples in the Murray–Darling Basin, supporting cultural, social, economic, spiritual, and environmental outcomes.
Managed by DCCEEW, AWEP launched its Water Market Intermediary–led limited tender on 11 November 2025 and its Market–led limited tender on 9 July 2025. Both tenders have been extended until 31 December 2025.
As of 9 July 2025, AWEP has completed purchases totalling $1.2 million, securing 290 ML of water entitlements.
Market participants have noted the difference in purchasing strategies between AWEP and other Commonwealth water purchase programs, where AWEP is adopting a more commercial approach to negotiations. Importantly, entitlements acquired through AWEP remain within the consumptive pool.
In collaboration with the Advisory Group, AWEP is also exploring how temporary water allocations might be used and traded, while enduring water holding arrangements are being developed.
DCCEEW is currently seeking surface water entitlements in 12 catchments across the Murray–Darling Basin, in accordance with its Strategic Purchasing Framework.
Table 10. AWEP Water Purchases as of 9 July 2025*
|
Catchment |
Volume (ML) |
|
Goulburn-Broken |
80 |
|
Lachlan |
10 |
|
Macquarie-Castlereagh |
200 |
Source: Ricardo 2025. DCCEEW 2025 Murray–Darling Basin Aboriginal Water Entitlements Program water purchasing - DCCEEW
* DCCEEW 2025 Murray–Darling Basin Aboriginal Water Entitlements Program water purchasing - DCCEEW
| 1 July | Water reforms start taking place from the Restoring Our Rivers Act – data standards and water market information obligations |
| 4 July | Minister for Water and DCCEEW announce the first tender for water purchases for the 450 GL recovery target, and release their Trading Strategy, Addendum to the Regulation Impact Statement |
| 8 July | Northern Basin Connectivity Expert Panel Final Report released |
| 15 July | First tender for the 450 GL water purchase strategy opens - 70 GL. SDL Compliance Statement released. |
| 5 July | DEECA release VWR post trade opening report – Barmah Choke and Goulburn-Murray |
| 8 July | Restoring Our Rivers selected catchment open tender published – 70GL/y |
| August | DCCEEW releases their Policy Position Paper for Water Markets Intermediaries Codes and Statutory Trust Accounting Framework. IGWC releases Controls Supporting Compliance with the Basin Plan. |
| 20 August | IGWC releases their SDL Compliance Statement 2022-23 |
| 20 August | Basin Plan Report Card released |
| 9 September | Mandatory climate reporting: Treasury Laws Amendment (Financial Market Infrastructure and Other Measures) Bill 2024 released |
| 11 September | Restoring Our Rivers selected catchment open tender closed |
| 18 September | Bridging the Gap 2024 strategic water purchases open tender published |
| 30 September | EOI 1 and EOI 2 water purchases opened |
| 1 October | DEECA releases their Broker Compliance Report |
| 15 October | Goulburn – Murray trade opening was delayed due to a technical issue with the Victorian Water Register |
| 31 October | DEECA releases their annual report 2023-24 |
| November | AWEP Intermediaries Led tender opens |
| 11 November | Goulburn-Murray post-trade report released |
| 13 November | Bridging the Gap 2024 strategic water purchases open tender closed |
| 14 November | Rescheduled Goulburn – Murray trade opening |
| 27 November | EOI 1 and EOI 2 water purchases closed |
| 18 December | MDBA Constraints Relaxation Implementation Roadmap published |
| 10 December | Draft National Water Agreement document published |
| 20 December | Strategy to improve the health of the Upper Murrumbidgee published |
| 15 January | VWR releases trade transparency data report |
| 22 January | Commonwealth Future Drought Fund Investment Strategy released |
| 11 February | First Nations Water Strategy 2025-30 published |
| 20 February | Tropical Cycle Alfred reported by BoM |
| 25 February | Restoring Our Rivers Trading Strategy update released |
| March | DCCEEW Releases Water Markets Intermediaries Trust Accounting Exceptions and Code Exemptions consultation paper. A large algal bloom is starting to affect the SA coastline. |
| 10 March | AWEP Market Led Purchasing tender opens |
| 25 March | Commonwealth Budget released |
| 26 March | Vic and NSW announce joint protocol for Barmah Choke opening |
| 28 March | Federal election announced for 3 May 2025 |
| 14 April | River Murray Flood Report released by SA Government |
| May | Lake Eyre received the most significant floodwaters in 15 years |
| 3 May | Federal election held – Labor re-elected |
| 12 May | MDBA Basin Plan Report Card published |
| 15 May | Duxton Water announces $121 million water entitlement sale to the Commonwealth |
| 19 May | Murray Watt announced as the new Minister for Environment and Water |
| June | Water Amendment (Water Markets Intermediaries Code and Trust Accounting Framework) Regulation 2025 overview released |
| 5 June | QLD Government directs SunWater to start Paradise Dam works |
| 15 June | MDBA Basin Wide Environmental Watering Strategy published |
| 25 June | Bridging the Gap strategic purchase of groundwater rights – northern Basin tender published |
| 30 June | AWEP market-led tender closes |
| 1 July | Water markets Intermediaries Code comes into effect – phase 1 |
Figure 22. Timeline of Murray-Darling Basin water policy events 2024-25.
5.2. Summary of key water policy events
Restoring Our Rivers Program Update
Under the Restoring Our Rivers Act, the Commonwealth has committed $494 million over four years, from 2023-24, to improve water delivery infrastructure. The funding supports the Resilient Rivers Program, which contributes to the 450 GL of environmental water by improving water savings.
Applications opened in January 2024, with ten projects already approved, including the recent Victorian-led Broken Reconfiguration Project. This project, approved in June with $132.1 million to advance its business case and associated costs, commenced with a feasibility study in 2023.
Implications for water market participants: Water recovered through successful Resilient Rivers programs will reduce the amount of water needed to be purchased by the Commonwealth. Programs will enhance the delivery infrastructure and yield beneficial environmental outcomes for water sources.
Updates to Barmah Choke Opening Processes
WaterNSW and DEECA have updated the protocol for managing applications for the July 2025 Barmah Choke opening, a new approach that will also apply to Goulburn to Murray trade openings in 2025.
This update aims to make the process more equitable and efficient, particularly in response to consistently high demand during trade events, while also reducing the administrative burden. A key change is the shift from a "first come, first served" approach to a "submission window", with eligible applications from both NSW and Victoria being combined and randomised to ensure fair assessment, all overseen by an independent observer.
Implications for water market participants: Participants engaging in trade opening must ensure they are informed of the new processes ahead of time to access trade opportunities.
2025-26 Budget
The 2025-26 Budget focused on exercising spending restraints to minimise the forecast deficit, reflected in the limited measures, especially with regard to water policy.
This Budget only saw one measure relating to the delivery of water outcomes, which was not for publication due to commercial sensitivities, however, it allocated funding towards additional voluntary water purchases ahead of the 31 December 2027 deadline.
The DCCEEW Portfolio Budget Statement notes the recovery of 450 GL of water to be on track for their announced recovery of 100 GL per year, until the deadline of 31 December 2027, upon which the full 450 GL is to be recovered.
The National Water Grid Fund (NWGF) was only allocated $87.7 million in new projects. Which comes after the 2024-25 Budget deferral of $592.3 million over 5 years for the same projects, pending business cases and planning works.
Implications for water market participants: Fiscal repair and cost of living relief was at the forefront of this year's budget, leaving little room for spending on new policy measures. While existing programs will be continuing, the Government is signalling a move to a more fiscally conservative economy.
Water Markets Information – Pre-Trade Data Obligations
The Commonwealth has released its final policy position paper on Water Markets Information Pre-Trade Data Obligations, aiming to improve transparency, integrity, and accountability in water markets, and align with recommendations from the 2021 ACCC Inquiry and 2022 Reform Roadmap.
These new obligations come into effect on 1 July 2026 and require data providers to submit water market information to the BoM for regulatory purposes. This enables the publication of data sets on a centralised hub while granting the ACCC and IGWC full access for enforcement.
Specifically, water market intermediaries with line-matching platforms and Basin State authorities to provide allocation trade offers from 1 July 2026, with all intermediaries required by 1 July 2027. Non-compliance will incur financial penalties, with pre-trade data publication by the BoM slated for 1 July 2027.
Implications for water market participants: New obligations will start to be implemented from 1 July 2026, non-compliance with the new regulations will result in financial penalties.
2025 Loddon Rationing Event
On 5 March 2025, GMW enacted the first rationing event in the Loddon Valley Irrigation Area since the introduction of the Place of Take Framework in November 2023. The event was sparked by high demand during the irrigation season, driven by strong water availability following a very dry winter and spring, combined with more recent hot conditions.
The event meant irrigations would be limited to only taking a percentage of their delivery share to ensure there is available capacity in the channel for supply.
During the rationing cycle, the amount allowed to be taken is based on the delivery shares attached to the service point. The expected level of demand during a rationing cycle will determine the percentage of rationing to be used. This is the percentage of a delivery share that irrigators are entitled to over a rationing cycle, which typically lasts 10 days but may vary.
The rationing event ended on 28 April 2025, after heavy rainfall across the area.
Implications for water market participants: Water users in the Loddon Valley Irrigation Area should stay informed about future rationing events. Lower Murray water users should take note of the impact of this rationing event in the Loddon to see what lessons can be learnt.
MDBA Constraints Relaxation Roadmap
The MDBA released their Constraints Relaxation Implementation Roadmap to assist Basin States and the Commonwealth with the delivery of water for the environment. The Roadmap builds upon the original Constraints Management Strategy 2013, which also aimed to advise governments on the constraints affecting environmental water delivery, through 12 key findings.
The purpose of constraint relaxation measures is to improve environmental outcomes and management by reducing barriers to environmental flows, thereby allowing increased flows between rivers and floodplains. This enables environmental outcomes to be achieved without the need for further Commonwealth water purchases.
Implications for water market participants: The Roadmap has 12 findings that aim to guide governments and communities to enable relaxation, and with the 31 December 2026 SDLAM deadline approaching, it is expected that these measures continue to be rolled out in the near future, in order for the Basin Plan to be delivered in full.
6.0. Outlook
6.1. Climate and rainfall outlook
Above average rainfall conditions forecast for the start of 2025-26, but there is uncertainty.
Rainfall outlooks by the Bureau of Meteorology for 2025-26 indicate wetter conditions are expected throughout the MDB to the end of 2025. This is consistent with International Meteorological Agencies (5 of 8 models).
With 2025-26 now underway, rainfall has been average to above average so far in the southern Basin (Figure 23). The current three-month rainfall outlook indicates at least a 60% chance of rainfall exceeding the median across the MDB (Figure 24).
BoM models suggest a neutral El Niño–Southern Oscillation (ENSO) until December. Similarly, these models expect a neutral Indian Ocean Dipole (IOD) in the coming months, possibly briefly being negative between September and October. A negative IOD usually drives above average rainfall in southern Australia.
A key driver for future allocations to entitlements in 2025-26 will be the distribution of rainfall. Rainfall in the headwater catchments will be critical.

Figure 23. One-month rainfall deciles, Murray-Darling Basin, July 2025 (issued 31 July 2025).
Source: Ricardo, 2025. Based on Bureau of Meteorology, 2025.

Figure 24. August-October rainfall outlook (issued 31 July 2025).
Source: Ricardo, 2025. Based on Bureau of Meteorology, 2025.
6.2. Allocation market outlook
Lower opening allocations than previous years.
Despite dry conditions and lower storage volumes, most high-security entitlements in the southern NSW and SA MDB enjoyed high opening allocations, equal to those in 2024-25. Allocations to general security and Victorian high reliability entitlements opened lower than 2024-25:
- Opening allocations were 31% for Vic Goulburn HRWS and 39% for Vic Murray HRWS. These are the lowest opening allocations since the 2019-20 and 2021-22 fiscal years, respectively.
- Opening allocations were 1% for NSW Murray GS (lowest since 2020-21) and 4% for NSW Murrumbidgee GS (lowest since 2019-20).
- SA Murray HS opened at 100% for the fifth consecutive year.
This means that the opening water availability decreased from 2024-25. Water available on 1 July 2025 was estimated at 1,513 GL, 44% lower than 2024-25 (estimated 2,722 GL).
Overall carryover volumes into 2025-26 were lower than in previous years (~2,100 GL) and are below the peak of 2023-24 (~3,200 GL). This is driven by dry conditions and reduced end of season water availability. The total carryover volume is still comparable to the 10-year average (~2,300 GL).
With a reduced risk of spill in the Victorian Murray and Goulburn (43% and 25% respectively), it's likely volumes currently held in Victorian spillable accounts will be made available later this year.

Figure 25. Opening allocations made to major southern Murray-Darling Basin entitlements, 2022-23 to 2025-26.
Source: Ricardo, 2025. New South Wales Department of Planning, Industry and Environment, 2025; Northern Victoria Resource Manager, 2025; South Australian Department for Environment and Water, 2025.
Note: In-text estimates of the volume of water allocated and carryover volumes include zones Vic 1A Greater Goulburn, Vic 6 Murray, Vic 7 Murray, NSW Murray and NSW Murrumbidgee. See Notes and Figure Notes sections for further details.
Reduced confidence in peak summer irrigation water availability.
In early 2025-26, allocation prices in the lower Murray and Murrumbidgee are around $260, $190 in the Goulburn and $230 in the upper Murray.
Reduced water in storage and lower carryover volumes mean irrigators should expect more volatile water availability and higher allocation prices. If at least average inflows eventuate, consumptive water availability could reach around 4,664 GL by the start of the peak irrigation season.
This year’s forecast is lower than last year’s available volume (about 5,600 GL) by early December. This is driven by lower forecast allocations to Murray general security entitlements compared to last year (32% compared to 47% allocated last year). Improved allocations will require substantially improved inflows to Murray headwater storages.
Ricardo’s view is that allocation prices in the next few months will be mainly driven by inflows to major storages.
BoM’s current climatic outlook (July 2025) is closer to average rainfall conditions over the storages. However, a shift to drier conditions could lead to even higher prices, with general security entitlements forecast to receive almost no additional water by the summer period.
|
|
Wet |
Average |
Dry |
Extreme Dry |
Est. of consumptive water available (GL) |
|
|
See note |
50 per cent change of exceeding |
90 per cent change of exceeding |
99 per cent change of exceeding |
Average inflows |
|
Vic 1A Goulburn HRWS |
100% |
100% |
57% |
38% |
677 |
|
Vic 6 Murray HRWS |
100% |
100% |
83% |
45% |
209 |
|
Vic 7 Murray HRWS |
100% |
100% |
83% |
45% |
672 |
|
NSW Murray 10 HS |
97% |
97% |
97% |
97% |
18 |
|
NSW Murray 10 GS |
|
32% |
7% |
1% |
299 |
|
NSW Murray 11 HS |
97% |
97% |
97% |
97% |
142 |
|
NSW Murray 11 GS |
|
32% |
7% |
1% |
81 |
|
NSW Murrumbidgee HS |
95% |
95% |
95% |
95% |
331 |
|
NSW Murrumbidgee GS |
|
38% |
14% |
9% |
533 |
|
SA Murray HS |
100% |
100% |
100% |
100% |
401 |
|
Total |
|
|
|
|
3,362 |
|
Total including estimate of carryover |
|
|
|
|
4,664 |
Note: Wet scenario not available for NSW general security entitlements. SA Murray HS received full allocations on 1 July 2025, so the full allocation is shown for all scenarios.
Note: Outlook months used to estimate the volume of water allocated by peak irrigation season are November.
6.3. Entitlement market outlook
The outlook for entitlement prices remains strong in the short term. The Commonwealth has not indicated that there will be a shift in water policy under new Minister Murray Watt. It remains likely the Commonwealth will shortly call for tenders for those who responded to Expression of Interest 1, with additional confidential negotiations with large water holders under Expression of Interest 2 likely to be conducted shortly too. This is likely to underpin entitlement prices and reduce supply to the broader non-Commonwealth entitlement market.
Challenging market conditions persist for some irrigators, especially winegrape growers and dairy farmers, which means the two-speed entitlement market noted in 2024-25 is likely to continue. Countering this trend is the limited entitlement supply available to the broader market. This may lead to increased competition between investors and corporates, including some who are buying back in after selling to the Commonwealth, which can put upward pressure on entitlement prices.
High reliability and high security entitlement markets
As noted over the past two seasons, winegrape growers and dairy farmers have been selling entitlements to support their broader business operations. Whilst export market conditions (China) have improved, there is still a significant oversupply of red wine grapes. Rising allocation prices, lower milk prices, lack of succession planning and consolidation of dairy processors are proving challenging for many dairy farmers. In many instances, sales from these market sectors have been smaller parcels at prices below the prevailing market; this is expected to continue in 2025-26. This would most likely affect the Victorian Goulburn HRWS market.
Trade tariffs announced by the US government have been a source of confusion for many; however, Australian agricultural producers seem well placed relative to their overseas competitors. Almond prices have improved, and exchange rates have moved in favour of exporters, improving the outlook for investment in Australian agriculture.
Based on data Ricardo has collated, 33% of all purchases towards the 450 GL target have been high reliability or high security entitlements, 90% of which were from Duxton Water’s sale to the government. Just 5% of purchases under the 70 GL tender have been high reliability or high security. However, market activity remains high for these entitlements, with recent sales of SA Murray HS in South Australia exceeding prices paid by the Commonwealth. Recent sales for NSW Murray and Murrumbidgee HS, along with Vic 7 Murray HRWS, have all exceeded entitlement market prices in 2024-25.
Some of these buyers are replacing entitlements that were sold to the Commonwealth for significantly higher prices; thus, they are less price-sensitive than other market participants. This behaviour is expected to continue while the Commonwealth remains an active market participant. Others are also looking to secure their water supplies due to ongoing concerns about future droughts and climate change.
Low reliability and general security entitlement markets
Demand for low reliability entitlements has remained relatively strong, reflecting the importance of securing carryover to manage water security risks. The exception has been in the Goulburn. This is likely due to changes to administrative processes for the Goulburn IVT, resulting in the implementation of a randomised selection process. While most market participants have broadly welcomed this as a more equitable approach, the changes have led to a softening of demand for Goulburn low reliability entitlements as participants hold off on purchases while evaluating their water strategies. Prices for Murray low reliability entitlements, especially those below the Barmah Choke, are likely to remain strong, given that there is no need to navigate downstream trade restrictions in this region.
If dry conditions persist, demand for general security entitlements may experience some softening. Prices have remained relatively stable over the past year, except for Commonwealth transactions, which have been higher. We are likely to see additional volumes purchased by the Commonwealth, which means we can expect to see more of these higher priced trades on water registers.
6.4. Policy and regulatory influences
Delivery of the Basin Plan in full by 31 December 2027
At the time of writing, we are yet to hear much on water policy from new Minister, Murray Watt. DCCEEW released an update on voluntary water purchase programs at the beginning of July; however, it was unclear when a tender for EOI 1 would be opened. It suggested that the government was consulting with irrigation infrastructure operators (IIOs) and Basin State governments on the socio-economic impacts of recovery under EOI 1. Nevertheless, we expect that DCCEEW could call for offers in the first quarter of the new water year.
The statement from DCCEEW also mentioned EOI 2, stating that the process of engaging with large water holders is still ongoing and there may be multiple tenders staged throughout the remainder of this calendar year.
The 2023 Restoring Our Rivers Act extended the delivery timeframe and provided additional funding to progress delivery; however, there is still a significant amount of work to be done.
The extended timeframes for delivery on the Plan included the extension for SDLAM supply projects to 31 December 2026, and delivery of the Basin Plan, including 450 GL additional water by 31 December 2027.
As of 31 March 2025, the Commonwealth still has a significant amount of water to be recovered to deliver in full, these include:
- 450 GL additional environmental water - 292.7 GL remaining
- Bridging the Gap - 6.7 GL surface water and 3.2 GL groundwater remaining
- SDLAM projects - 190-314 GL shortfall after reconciliation
With the December 2026 deadline looming, and the Murray-Darling Basin suggesting that the SDLAM shortfall is likely to be at the higher end of the shortfall range, there is likely to be an increased focus on delivering these projects.
As the SDLAM recovery targets are legislated under the Basin Plan and must be delivered, the Commonwealth would seek to recover this water through additional tender programs, or through a mandatory SDL adjustment which would directly reduce the amount of water available for consumptive use.
If the Commonwealth were to enact the SDL adjustment, it would result in a reduction in allocations to entitlements, or a decrease in the volume of entitlements legally mandated by the Commonwealth. This would likely be a targeted approach in nominated regions and systems, where SDLAM projects have underperformed or the environmental benefit would be greatest. The outcome of the shortfall will not be determined until reconciliation has been concluded after 31 December 2026.
While the 605 GL SDLAM recovery is legislated under the Basin Plan, the recovery of the 450 GL additional environmental water is an in-principal agreement between Basin states and the Commonwealth. In its first term, the Albanese Government had pledged to recover the full 450 GL; however, there is no legislated requirement for this.
Basin Plan Review Updates and Progress
The Basin Plan Review is scheduled for release in late 2026 and will assess the effectiveness of the Basin Plan to date, as well as its progress in implementing the outlined objectives. It will also set out the direction of Murray-Darling Basin policy for the next decade. The review will focus specifically on environmental outcomes, First Nations involvement in water management, climate change risk assessments, and SDL outcomes.
The MDBA released the 2024 Basin Plan Early Insights Paper, which is used to inform the 2026 Basin Plan review. This has formed the basis for the roadmap to the Basin Plan Review, to help engage with stakeholder and provide input into key success indicators. The report included key challenges, areas of focus, and emerging themes that will inform the 2026 Basin Plan Review.
The report found that full implementation of the Basin Plan remains critical to Australia’s water use in future climate scenarios and to ensure a sustainable balance of water use. The report found that while progress has been made, significant work remains and challenges persist, especially under future climate conditions.
Water market participants should stay up to date with future updates and take the opportunity to contribute to any consultation on the 2026 Basin Plan Review.
References
Australian Broadcasting Corporation (2025). Kati Thanda-Lake Eyre set for most substantial water fill in at least 15 years. Available at https://www.abc.net.au/news/2025-04-12/floodwaters-kati-thanda-lake-eyre-water-fill-largest-lake/105157580 [Accessed 15/7/2025].
Australian Broadcasting Corporation (2025). South Australian drought sets low-rainfall records in farming areas. Available at https://www.abc.net.au/news/2025-06-10/south-australia-drought-sets-low-rainfall-records-farming-areas/105376286 [Accessed 15/7/2025].
MDBA (Murray-Darling Basin Authority) (2025). End of day Barmah Choke transactions data. Available at https://www.mdba.gov.au/managing-water/water-markets-trade/interstate-water-trade/barmah-choke-trade-balance [Accessed 15/7/2025].
Murray Irrigation Limited (2025). Daily sales data. Available at (current water year only) < https://www.murrayirrigation.com.au/live-daily-sales> [Accessed 28/6/2025].
NSW Government (2025). Interactive Combined Drought Indicator map and timeseries. Available at https://www.dpi.nsw.gov.au/climate_applications/interactive-drought-map [Accessed 15/7/2025].
Northern Victoria Resource Manager (NVRM) (2025). Outlook for the 2025/26 season. Available at <https://nvrm.net.au/outlooks/current-outlook > [Accessed 17/07/2025].
Victorian Water Register (2025). Trade opportunities each year between zones. Available at < https://www.waterregister.vic.gov.au/water-trading/market-insights/trade-opportunities> [Accessed 17/07/2025].
NSW Government (2025), Usage dashboard. Available at < https://water.dpie.nsw.gov.au/our-work/allocations-availability/water-accounting/usage-dashboard> [Accessed 15/7/2025].
SA Government (2025). Crop and pasture reports. Available at https://pir.sa.gov.au/primary_industry/grains/crop_and_pasture_reports [Accessed 10/7/2025].
About Australia's Water Markets
Background
In Australia, there are two distinct but related water markets: entitlement markets and allocation markets.
Entitlement markets enable the trading of water entitlements. Water entitlements are ongoing rights to receive an annual share of available water resources in a consumptive pool (e.g., a river system or catchment). They are analogous to a land property right, are generally secure and mortgageable in the same way, and have substantial value. Each catchment typically has a small number of entitlement ‘classes’, and generally all entitlements within a given class are homogenous.
Allocation markets enable the buying and selling of water allocations. Water allocations are the volumes of water allocated to water entitlement holders during the water year (1 July to 30 June). They are a physical good analogous to a commodity, and are extracted from water courses and applied as inputs to production or the environment. Based on the water availability and demand at a given time, the value of water allocations per unit varies (usually expressed in $ per megalitre (ML)).
There is no single national Australian water market. Rather, there are many individual markets determined by the hydrological characteristics of physical water systems. Where hydrological connectivity exists, such as in the southern Murray-Darling Basin, trade between markets or zones is possible.
ENTITLEMENT MARKETS
Purpose, use and operation
An entitlement specifies an annual volumetric share of available water resources in a specified catchment or system. Entitlement holders receive their share of the available water resources as water allocations. Allocations vary from year-to-year based on rainfall, inflows, water held in storage and other factors. The entitlement market enables trade in the ongoing right to receive these water allocations. Entitlements can be held by virtually any party in any location.
The entitlement market is largely used by irrigated agricultural producers, but is increasingly being used by investors, water utilities (including urban suppliers) and environmental water holders. These water market participants use the market to modify their long-term arrangements for facilitating production, or meeting environmental requirements, or urban demand.
State government agencies govern the operation of entitlement markets, including rules and regulations regarding how and where trade can occur. Depending on the jurisdiction, other agencies (such as land titles or property registration agencies) will be involved. Third parties (such as exchanges, brokers and conveyancers) often play a role in facilitating entitlement trade.
Key drivers of market outcomes
The value of water entitlements is largely determined by their reliability characteristics. Reliability characteristics differ across entitlement classes. Higher reliability entitlements provide larger volumes of water allocations over the long term, and more consistently provide water allocations each year than lower reliability entitlements.
Trade in entitlements is related to longer-term production decisions and the characteristics of different irrigated agricultural enterprises, including their tolerance for risk. Producers who may be expanding or contracting production drive market activity, as do market participants who hold large portfolios of entitlements such as investors or large agricultural enterprises. Purchases of water on behalf of the environment have also driven market activity in the past.
ALLOCATION MARKETS
Purpose, use and operation
The allocation market provides the ability to trade physical water between parties for use, further trade, or carryover. Allocation trade can generally only occur between parties who are in trading zones that are hydrologically connected such that water can be delivered (or substituted by other water from a shared storage).
The water allocation market is mainly used by irrigated agricultural producers (including rice, dairy, horticulture, cotton and others), and environmental water managers. Irrigators use the market to sell water excess to requirements or buy additional water for use during dry periods or when temporarily expanding production. Environmental water holders may similarly buy or sell when they have short-term surpluses or deficits.
Similar to entitlement markets, state government regulators determine annual allocations based on entitlement characteristics (that determine priority and how much water is allocated to individuals), and market rules to manage issues such as connectivity between systems and transmission losses. State governments, either directly or via their water utilities, play a key role in facilitating allocation trade, including ensuring compliance with rules and regulations, and by approving and processing trades. Parties seeking to trade allocations may utilise intermediaries such as water exchanges and brokers.
Key drivers of market outcomes
The volume of water allocated to entitlement holders each year is a key driver of allocation market outcomes (including prices and volumes traded) because it strongly influences the total volume of water available for use or trade. When allocations are low, water is scarce and prices are high. The opposite is true when allocations are high. Allocation levels reflect broader water availability, including rainfall and inflows in relevant catchments, and volumes held in storages. Other key drivers in allocation markets include conditions in markets for irrigated agricultural products, and conditions in substitute input markets.
Notes
Please see the PDF copy for full notes section.
- Data sources
- State water register trade data and volume weighted average prices
- Data cleaning method
- Irrigation corporation trade data
- Carryover estimates
- Entitlement on issue data
- Rounding errors
- REI Error - August 2025 update
- Ricardo Entitlement Index
- Table Notes
- Figure Notes