


Ricardo celebrates 25 years of the UK-AIR website


Ricardo celebrates 25 years of the UK-AIR website
For over 25 years, UK-AIR has been at the forefront of meeting the Department for Environment Food and Rural Affairs (Defra) and the UK Devolved Administration’s statutory commitments for air quality reporting and keeping the public informed on air pollution matters.
It’s comprehensive data storage and analysis features have allowed:
- Central and local government to make informed policy decisions and accurately track progress against achieving targets.
- Researchers to carry novel investigations and uncover evidence of many issues of national or international importance – such as anomalies in real-world vehicle emissions or links to public health concerns.
In recognition of the site’s longevity, Ricardo is reflecting on what has been achieved over the years. We are proud that many of our air quality and digital experts have been influential and committed in driving development of UK-AIR to keep pace with rapid advances in public information systems and website technology.
A key function of the UK-AIR website is to provide a 'one-stop-shop' for public air quality information. Over the years, it has grown in size and scale, underpinned by a data archive comprising of over 400 million measurements and more than 140 million statistics.
Now functioning as one of the most powerful and comprehensive public-facing ambient reporting resources in the world, we run down the milestone developments over the years and how they helped shape today’s UK-AIR.
1992 – Development of innovative digital communications technology and air pollution forecasting models allow for daily air quality bulletins
In 1992, the Department of Trade and Industry (DTI)’s then, Warren Spring Laboratory’s team (comprising several of Ricardo’s current UK-AIR team), was collecting air quality measurements from a “state-of-art” automatic monitoring network of around 30 monitoring stations across the UK for government research. From the data gathered, the team developed innovative digital communications technology and air pollution forecasting models to allow daily air quality bulletins to be issued to the Met Office for the first time ever via file transfer and dot matrix printing. The height of modern technology allowed tables of information to be transferred by MODEM to a Met Office computer and automatically printed for the forecasters to read. These simple text bulletins were to be presented at times of ‘heightened concern’ i.e. periods in which pollution was increasing above normal levels and was likely to breach EU alert limits. To support this update, automatic graphical computer displays were also installed at Defra and the Devolved Administrations so that staff could visualise the latest data.

1994 – Automation of hourly data updates to Teletext services and establishment of air quality banding system
In 1994, those initial reporting arrangements were formalised into Defra’s Data Dissemination Unit (DDU) contract. Delivery of this work involved further technical innovation to allow for the automation of hourly data updates to Teletext services as well as emailing daily bulletins to the Met Office. This enabled anyone with a television to access information on ambient air pollutant concentrations direct from the comfort of their own homes for the first time. The DDU system was built to automatically create and publish the Teletext pages and generate emails within 45 minutes of receiving data every hour 24/7, 365 days a year.
At this time, the DDU contract was managed by the National Environmental Technology Centre (NETCEN), formed from the merger of Warren Spring Laboratory and AEA Harwell, bringing even more of Ricardo’s present team together.
To simplify presentation of the information on Teletext and weather bulletins for the public, the first four-tier banding system was developed based on health-based evidence from the Government’s Expert Panel on Air Quality Standards’ (EPAQS) group – setting air quality standards for Ozone (O3), Nitrogen Dioxide (NO2) and Sulfur dioxide (SO2). The banding classifications rated current air quality as VERY GOOD, GOOD, POOR or VERY POOR, in addition to providing a forecast for the next day. For Benzene and 1,3 butadiene, pollutant levels were reported via Teletext as being ‘above’ or ‘below’ the running annual mean according to EPAQS’ air quality standard.
1995 – UK Air Quality Information Archive established, disseminating air quality information to various public-facing outlets
By 1995, the NETCEN team were at the forefront of the rapidly evolving capability of online databases and websites. This led Defra to contract Ricardo (then ‘AEA Technology’) to develop the world’s first fully online air quality website, known as the UK Air Quality Information Archive. This first iteration of UK-AIR allowed the latest air quality bandings and forecast to be accessed over the internet, included the build of a hourly freephone public information service (0800 556677) and automated email bulletins to inform registered stakeholders. Direct email dissemination allowed for the supply of information on current air quality to public-facing outlets such as the Met Office, BBC, Sky TV, newspapers and others at any time of the day to best suit media and news publication deadlines.
1997 – Change to national air quality banding system and widening of pollutants monitored
Toward the end of 1997, NETCEN worked with Defra and their expert health group, the predecessor of the present day Committee on the Medical Effects of Air Pollutants (COMEAP), to change the banding terminology for levels of ‘air quality’ to ‘air pollution’ instead, as this was deemed to be more immediately understandable by the public. The band classifications were also rebranded as Low, Moderate, High and Very High in relation to pollution levels. In addition, the breakpoint between Low and Moderate air pollution was updated to align with EPAQS air quality standards. Additional pollutants, Carbon monoxide (CO) and Particulate matter (PM10) were added to the bandings broadening the scope of pollutants monitored.
2001 – Increased granularity of monitored pollutants to better inform industry and Government understanding
In 2001, following a Defra consultation, more granularity was added to the public air quality information systems by dividing each band evenly into three to produce a 10-point Air Pollution Index. This change meant reporting data now matched the UV index approach favoured by the BBC and Met Office at the time, allowing for better comprehension and easier dissemination of information to those outlets.
2004 – Launch of more sophisticated, 2nd generation UK Air Quality Archive
Around 2004, Ricardo (as AEA Technology) worked with Defra to design and develop a 2nd generation UK Air Quality Archive, which looks much more like the UK-AIR website of today. Among the innovative features of the new website iteration was the introduction of the first online maps for displaying regional pollutant concentrations and Air Quality Management Areas (AQMA). This new functionality allowed users – for the first time – to view local information more easily, providing greater insight into the high-resolution spatial distribution of UK air pollutant concentrations.
2011 – Air Pollution Index revised to include PM2.5 concentrations and the introduction of the Daily Air Quality Index (DAQI)
In 2011, the Air Pollution Index was reviewed by COMEAP, based on health impacts research at the time and the approach taken by other countries in Europe and the rest of the world. Following the review, CO was dropped from the list of nationally monitored pollutants due to low reported concentrations and PM2.5 was added as a result of more concern and information becoming available. Some of the breakpoints and metrics for certain pollutants were also updated slightly, in addition to terminology for the Daily Air Quality Index (DAQI) being introduced for the first time. In practice, bandings under the DAQI essentially remained as a 1-10 colour coded index with four air pollution levels described as Low, Moderate, High and Very High. AEA Technology (as we were then called) implemented the new DAQI on UK-AIR, and wrote guidance notes on behalf of Defra, with the new system coming into use from 1st January 2012.
2013 – Geographic Information System (GIS) maps functionality added to UK-AIR
In 2013, Ricardo-AEA added the first fully interactive Geographic Information System (GIS) maps to UK-AIR, allowing zoomable display and query of AQMA information, as well as download of 1km gridded maps of UK air quality data. Reporting of Stratospheric Ozone readings and UV radiation index data were also merged into UK-AIR at this point, again adding to the scope of pollutants monitored and reported on. This could be described as generation 2.5 of the website.
2018 – Design and deployment of 3rd generation UK-AIR website, offering advanced user interactive tools and public health information on air pollution
2018 marks the period in this potted history, in which Ricardo’s Energy and Environment division managed the design and development of the current or 3rd generation of the UK-AIR website, incorporating richer graphical and interactive content. This version of the website is what current users will be familiar with today.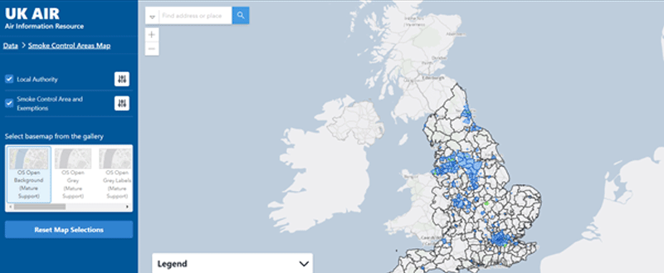
25 years of innovation and beyond
Ricardo is proud to have successfully managed and developed UK-AIR over the past 25 years, in addition to supporting Defra with a much broader range of policy support services, many of which are interlinked with the flexibility and reliability of the underlying database which Ricardo also hosts.
UK-AIR is a huge world-renowned resource that continues to expand and provide comprehensive informative services that include:
- Accessible real time information for public health protection
- Automated multi-channel dissemination across digital, SMS, email and @DefraUKAir
- Interactive online database and openair data analysis tools.
- GIS mapping tools for UK Air Quality, including air quality forecasts, the latest Statutory Compliance situation, Air Quality Management Areas and more recently, Smoke Control Areas
- Library of all relevant Government funded research
- INSPIRE-compliant spatial data including the UK Air Quality Data Catalogue
As for the future of the website, Defra is currently reviewing its air quality information systems and has committed to further development of UK-AIR to continue to improve the way the public interreacts with air quality data, making it easier to understand and more accessible to a wider audience. At Ricardo, we are excited by the prospect of developing UK-AIR further and look forward to supporting future innovations.
Ricardo has decades of experience in the successful delivery of bespoke, informative, public-facing air quality information websites such as Defra UK-AIR, Air Quality England, Air Quality Scotland, Gibraltar, Heathrow Airwatch and KentAir. All of which are fully modular and easily configurable to suit customer needs.
For more information on our air quality public information and alert services or to discuss how Ricardo can support you to meet your public communication and information goals, get in touch.


