


Wildfires in the UK – improving spatial distribution observations


Addressing the ever-increasing threat of wildfires is of paramount importance for countries near the equator to the mid-latitudes. Wildfire occurrences are projected to increase in both intensity and frequency in the future as a result of shifts in global climate, land use and forest management. Even though wildfires are an integral part of the natural dynamics in several biomes (an area classified according to the indigenous species), changes in frequency and extent accelerate impacts on many aspects of the structure, composition, and functioning of ecosystems. Not only this. recent wildfires around the globe, from Europe, to North America and Asia, have caused extensive and devastating damage to both people and economies.
As fires are big emitters of atmospheric NOX and PM (particulate matter), the effects on air quality are severe. Specifically, fine particulate emissions (PM2.5) from wildfires are linked to adverse health impacts (Cascio, 2018), with mortality rates increasing on fire days with poor air quality (Johnston et al., 2011; Morgan et al., 2010). It is well-documented that an increase of 10 μg/m3 in a two-day moving average of fine particulate matter is associated with an increase of 0.68% in daily all-cause mortality (Liu et al., 2019).
Mapping wildfires in the UK national emissions inventory
The UK has experienced an unprecedented number of large wildfires in recent years. Such fires events are expected to follow the global trend, becoming more frequent and widespread and hence there is an urgent need to accurately map such occurrences at the correct locations, helping us to better understand associated NOX and PM emissions.
The UK National Atmospheric Emissions Inventory (NAEI) is compiled by Ricardo and is the main evidence base for both greenhouse gas and air quality pollutant emissions in the UK. The inventory provides timeseries estimates of emissions to the atmosphere from UK sources at a high level of disaggregation. Ricardo’s geospatial team are responsible for mapping these emissions at 1x1km grid level and making them available to the public via the interactive NAEI website. For the latest inventory submission (NAEI 2021), published in July 2023, the inventory included a significantly improved estimate of the spatial distribution emissions arising from wildfires.
Wildfires improvement work
A recent improvement to mapping has enabled the location of fires in the UK to be better represented in the inventory i.e. showing where they have taken place. This has been possible by drawing upon the latest Earth Observation techniques – superseding previous approaches that distributed emissions estimates equally across forest and generic vegetation land cover maps.
Ricardo’s team developed the improved methodology, in partnership with remote sensing experts at CTrees1 (part of the Climate TRACE2 coalition), and drawing upon data made available from satellite earth observation missions since 2015.
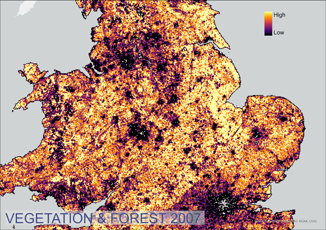
The improvement maps earth observation fire data to NAEI-specific grids. Furthermore the carbon emissions mapped by Climate TRACE are then used to distribute air quality pollutant emissions and the specific fire data sectors (types of biomass) that contributed to this update were wetlands, shrubgrass and forest. A visual representation of this improvement can be seen in the Figure 1.
 |
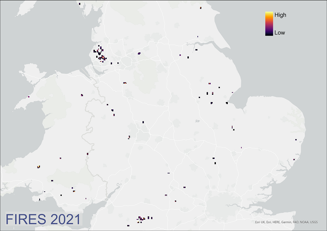 |
Figure 1: Vegetation and forest distribution in last year’s NAEI (using land cover data from 2007; left) and the updated fire emissions’ distribution (Climate TRACE’s data; right).
Future research and development
The aforementioned improvement, has significantly improved the spatial allocation of fires in in the NAEI 2021, specifically the SNAP113 sector of the inventory that captures ‘Other natural emissions’.
In parallel to the data provision from Climate TRACE, Ricardo has developed a regional solution for the UK which provides enhanced accuracy when compared to global alternatives that rely on the standard approach to calculating spatial distributions. Through this work our Earth Observation specialists and geospatial data scientists have created a fully automated data processing pipeline that delivers an annual burnt area map of the UK, providing stakeholders with better insight into environmental challenges through an improved evidence base. Figure 2 presents a visual overview of the key steps in elucidating the locations of fires in the UK. While the primary focus has been a Burnt Area Product (mapping of surfaces which have been sufficiently affected by fire to display significant changes in vegetation cover), our team has designed the pipeline to be flexible. As a result, we are now developing wider capabilities to monitor other events and features such as algal blooms, soil health and glacial changes.
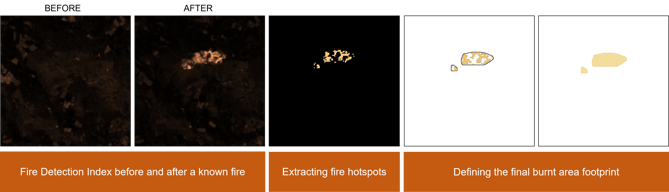
Figure 2: Images showing a visual representation of the fire mapping pipeline
For more information, get in touch with our Earth Observation specialists and geospatial data scientists at info@ricardo.com.


