Follow Ricardo plc for regular updates
How to get better value from your AQ sensor system
05 Apr 2022
SHARE


In our previous blog, we explained that the variability in performance of ‘plug and play’ sensors is such that the end user needs to do a lot of work to make sure the sensor systems they invest in a) work, and b) are calibrated properly to get useful data.
This time, we’ll explore how different sensor systems perform, evaluate measurement uncertainties and consider how future development might improve data processing.
A question left unanswered in the previous blog was:
How confident can you be that the measurements from your sensor system are actually of any use?
At present, there is no definitive advice to help users apply quality control (QC) to their sensor system data or evaluate the performance from a data quality objective (DQO) perspective.
Ricardo is a member of the European Committee for Standardization’s (CEN) WG42 working group, which is developing standards for ambient air quality sensors. A performance specification for testing gas sensor systems has just been published (TS 17660-1 – a PM specification will follow in 2022), and it will provide confidence about the quality of the system purchased.
While general standards for performance herald welcome progress, such a system will still tell only part of the story. To have confidence in measurements, additional QC will still need to be applied to ensure that the data quality of operational sensor systems is properly assessed and controlled.
As part of our QA/QC process, Ricardo makes use of a background reference monitoring station on the outskirts of London to assess the ongoing performance of a number of sensor systems from different suppliers. We have so far evaluated performance for the following sensor systems:
- Aeroqual AQY
- Airly
- Alphasense EDT
- AQMesh
- Clarity
- Earth Sense Zephyr
- Plume Labs Flow
- South Coast Science Praxis Urban and Praxis Cube
- Vaisala AQT420 and AQT 530
- Vortex IOT
Where we use these systems for our own measurement campaigns, we run the sensors at the reference station regularly to apply seasonal calibration factors during data collection and processing. This is an important point: the relationship between reference and sensor can change dramatically with weather changes.
The animated scatter plots below show just how much variation there can be between sensor and reference systems:
The disparity shown in these plots illustrates the difficulty (for this particular sensor system) in applying single calibration factors for the PM and NO2 measurements. There are periods where the sensor output bears no resemblance to real measurements.
So, what options are available to derive greater confidence from sensor measurements?
One option could be to run sensor systems continuously at reference stations. This would assess how the relationship changes, evaluate drift and quantify measurement uncertainty. This information could be used to process data from sensor systems not co-located, provided the internal consistency of the sensors is satisfactory.
Can this information be used to produce valuable data? Let’s take a look.
In October 2021, Ricardo had the opportunity to run several sensor systems side-by-side at the reference station, which allowed us to see how different systems respond under identical conditions in the same environment. The results are shown below.
Nitrogen Dioxide (NO2):
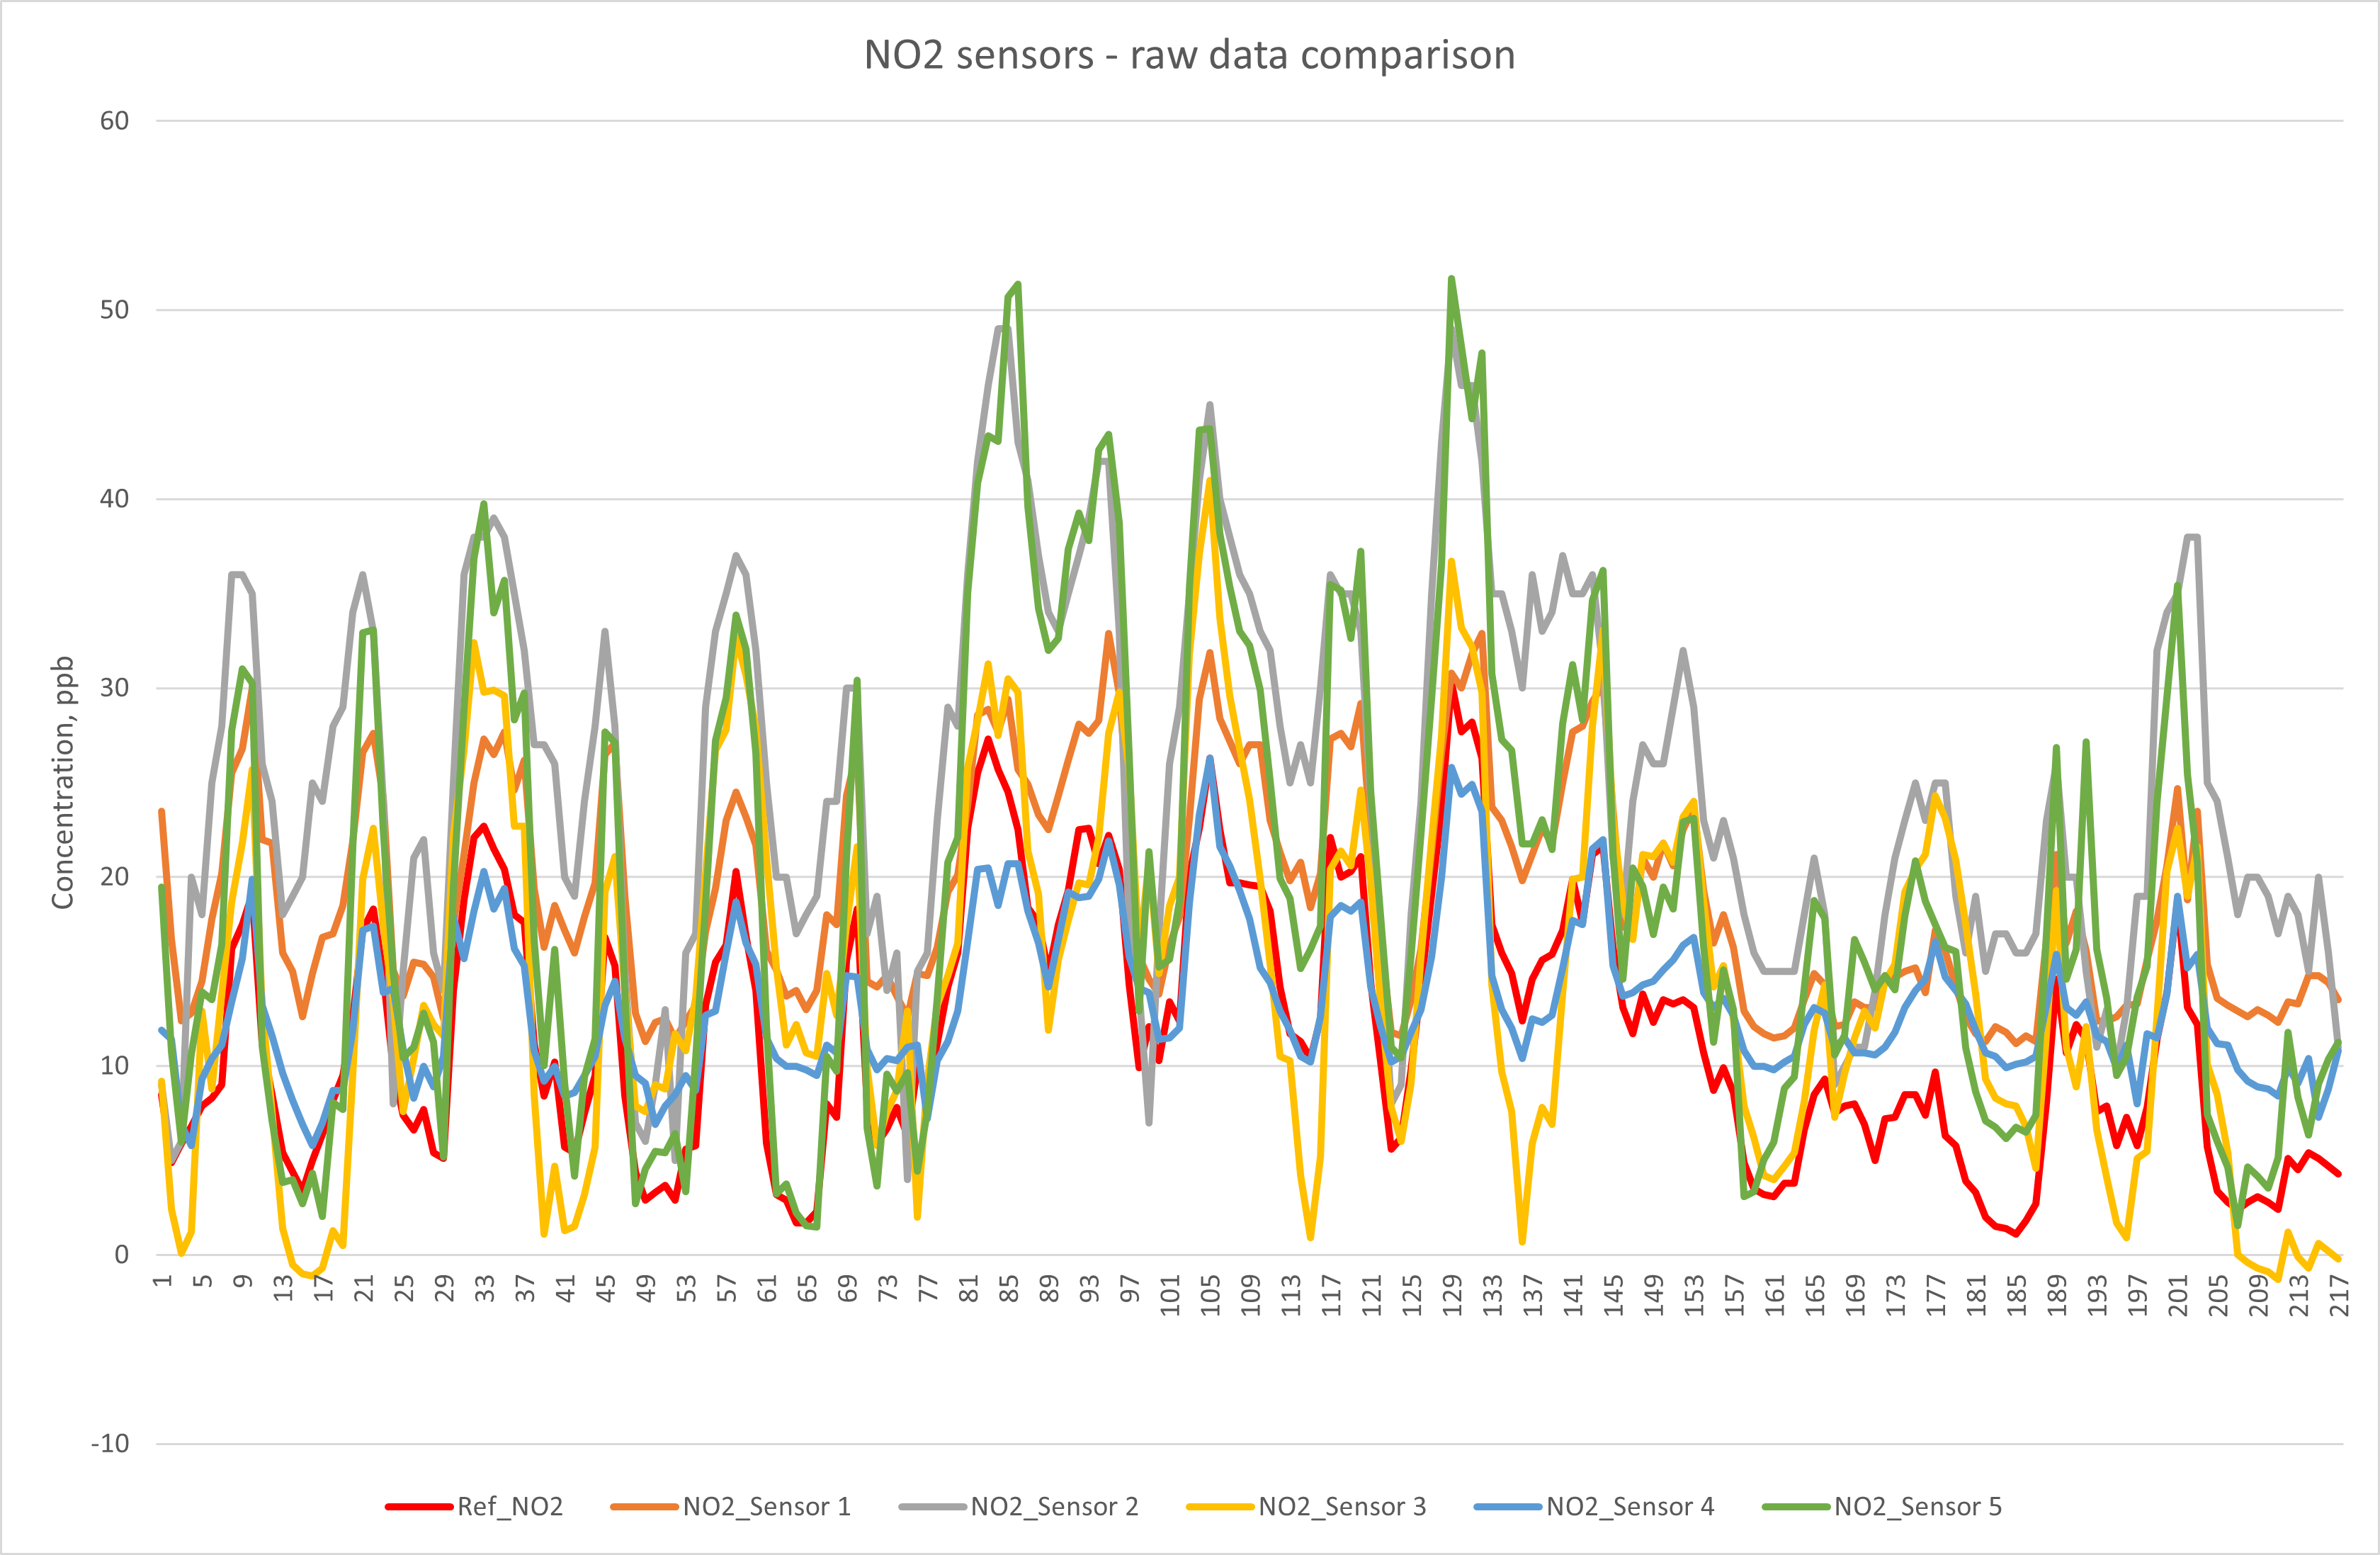
This plot shows that raw data from all five sensor types broadly follows the profile of the reference data, but the scale of the uncorrected differences varies widely between types, sometimes reporting concentrations more than 20ppb higher than the reference measurement. The raw data can be analysed to explore its relationships to the reference method, as shown in the table below:
| Parameter | Uncertainty | R2 | Slope | Offset |
| Sensor 1 | 12.3 | 0.88 | 0.854 | 9.2 |
| Sensor 2 | 130.0 | 0.75 | 1.583 | 6.7 |
| Sensor 2 (slope / offset corrected) | 16.7 | 0.75 | 0.935 | 0.8 |
| Sensor 3 | 101.2 | 0.64 | 1.534 | -3.3 |
| Sensor 3 (slope / offset corrected) | 22.0 | 0.64 | 0.904 | 1.1 |
| Sensor 4 | 72.8 | 0.80 | 0.573 | 6.7 |
| Sensor 4 (slope / offset corrected) | 13.5 | 0.80 | 1.064 | -0.7 |
| Sensor 5 | 166.3 | 0.91 | 1.852 | -2.2 |
| Sensor 5 (slope / offset corrected) | 9.5 | 0.91 | 0.994 | 0.3 |
Table 1 – summary of NO2 sensor performance (uncorrected unless stated)
Uncertainty values are calculated by following procedures described in the ‘Guide to the Demonstration of Equivalence’: https://ec.europa.eu/environment/air/quality/legislation/pdf/equivalence.pdf. The uncertainty must be within 25% to fulfil the requirement for indicative status for NO2.
Sensor system 1 was the only one of the five tested systems that provided NO2 measurement data that can be used uncorrected out of the box. The other four systems would require correction for slope and offset to provide data that meets the indicative status objective.
In the chart below, the calculated slopes and offsets were applied (where required) to the raw data, and the processed datasets compared to the reference data.
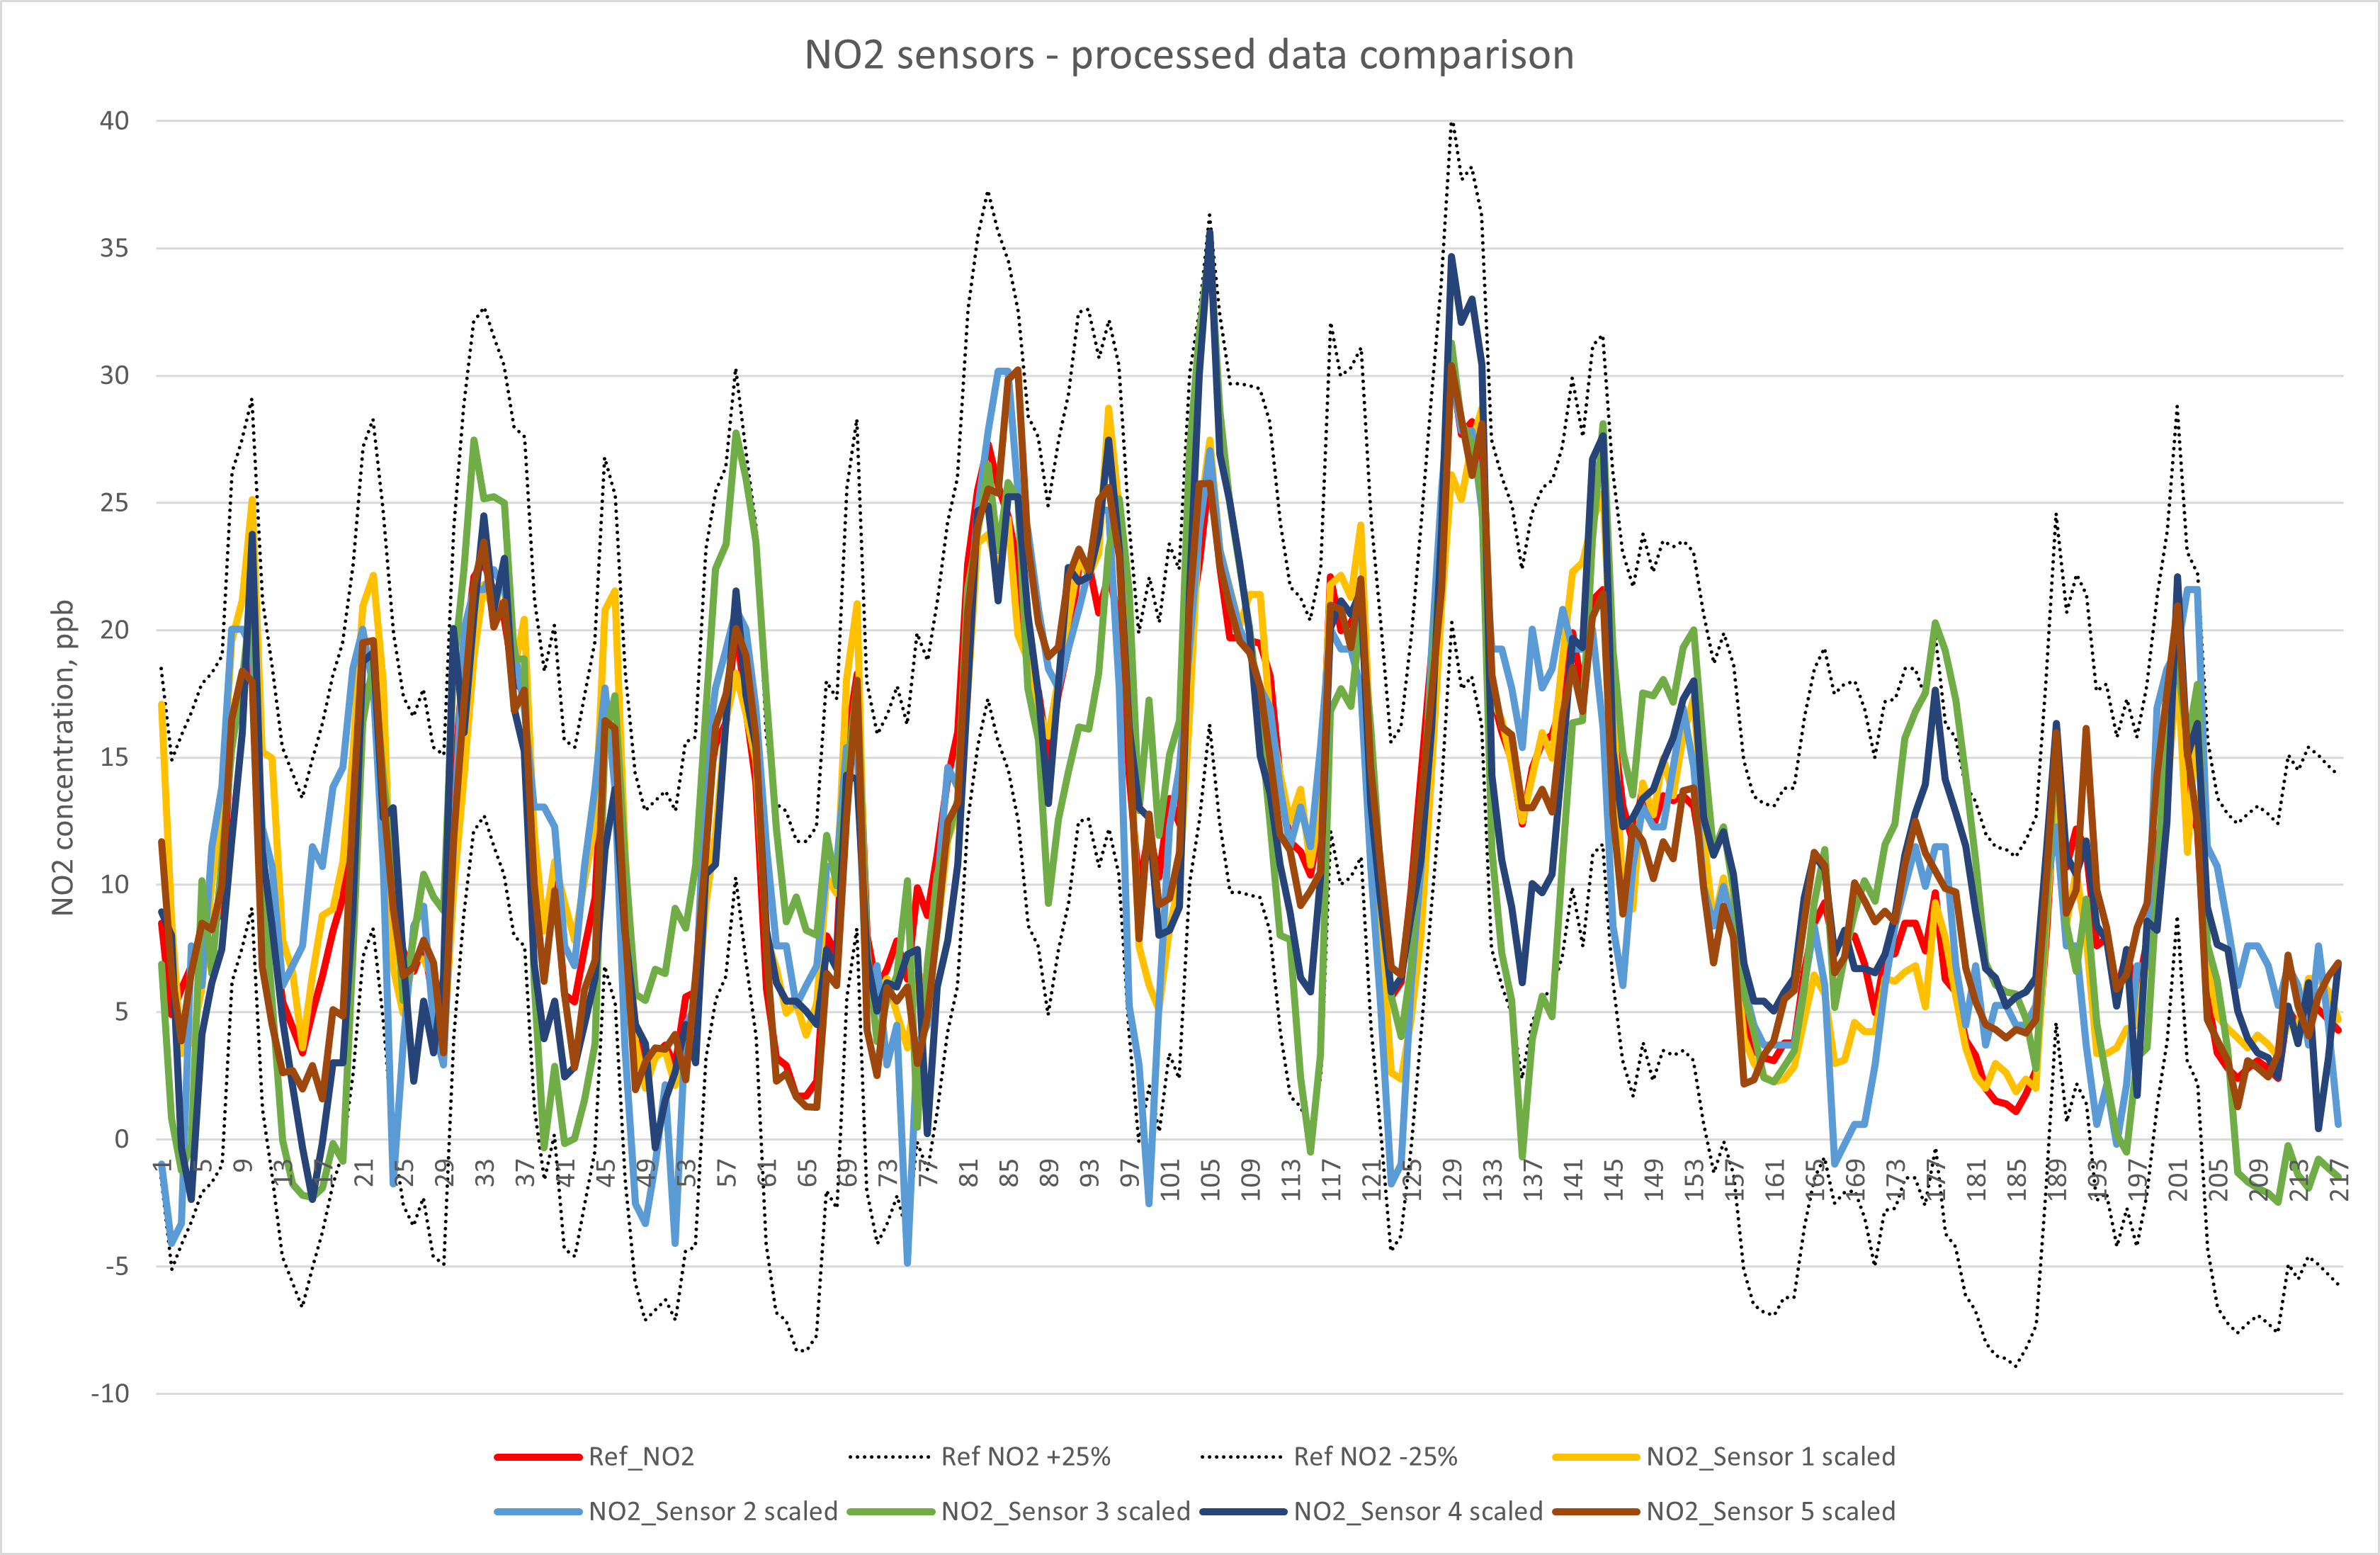
The plot shows that, once corrected for slope and offset, all sensor agreement is within ±10ppb (25% at the annual mean limit value) of the reference measurement. For this to be valid long-term, these relationships need to be evaluated and corrected (where necessary) regularly.
The moral of the story – QA/QC verification should be ongoing not sporadic
PM10 Particulate Matter:
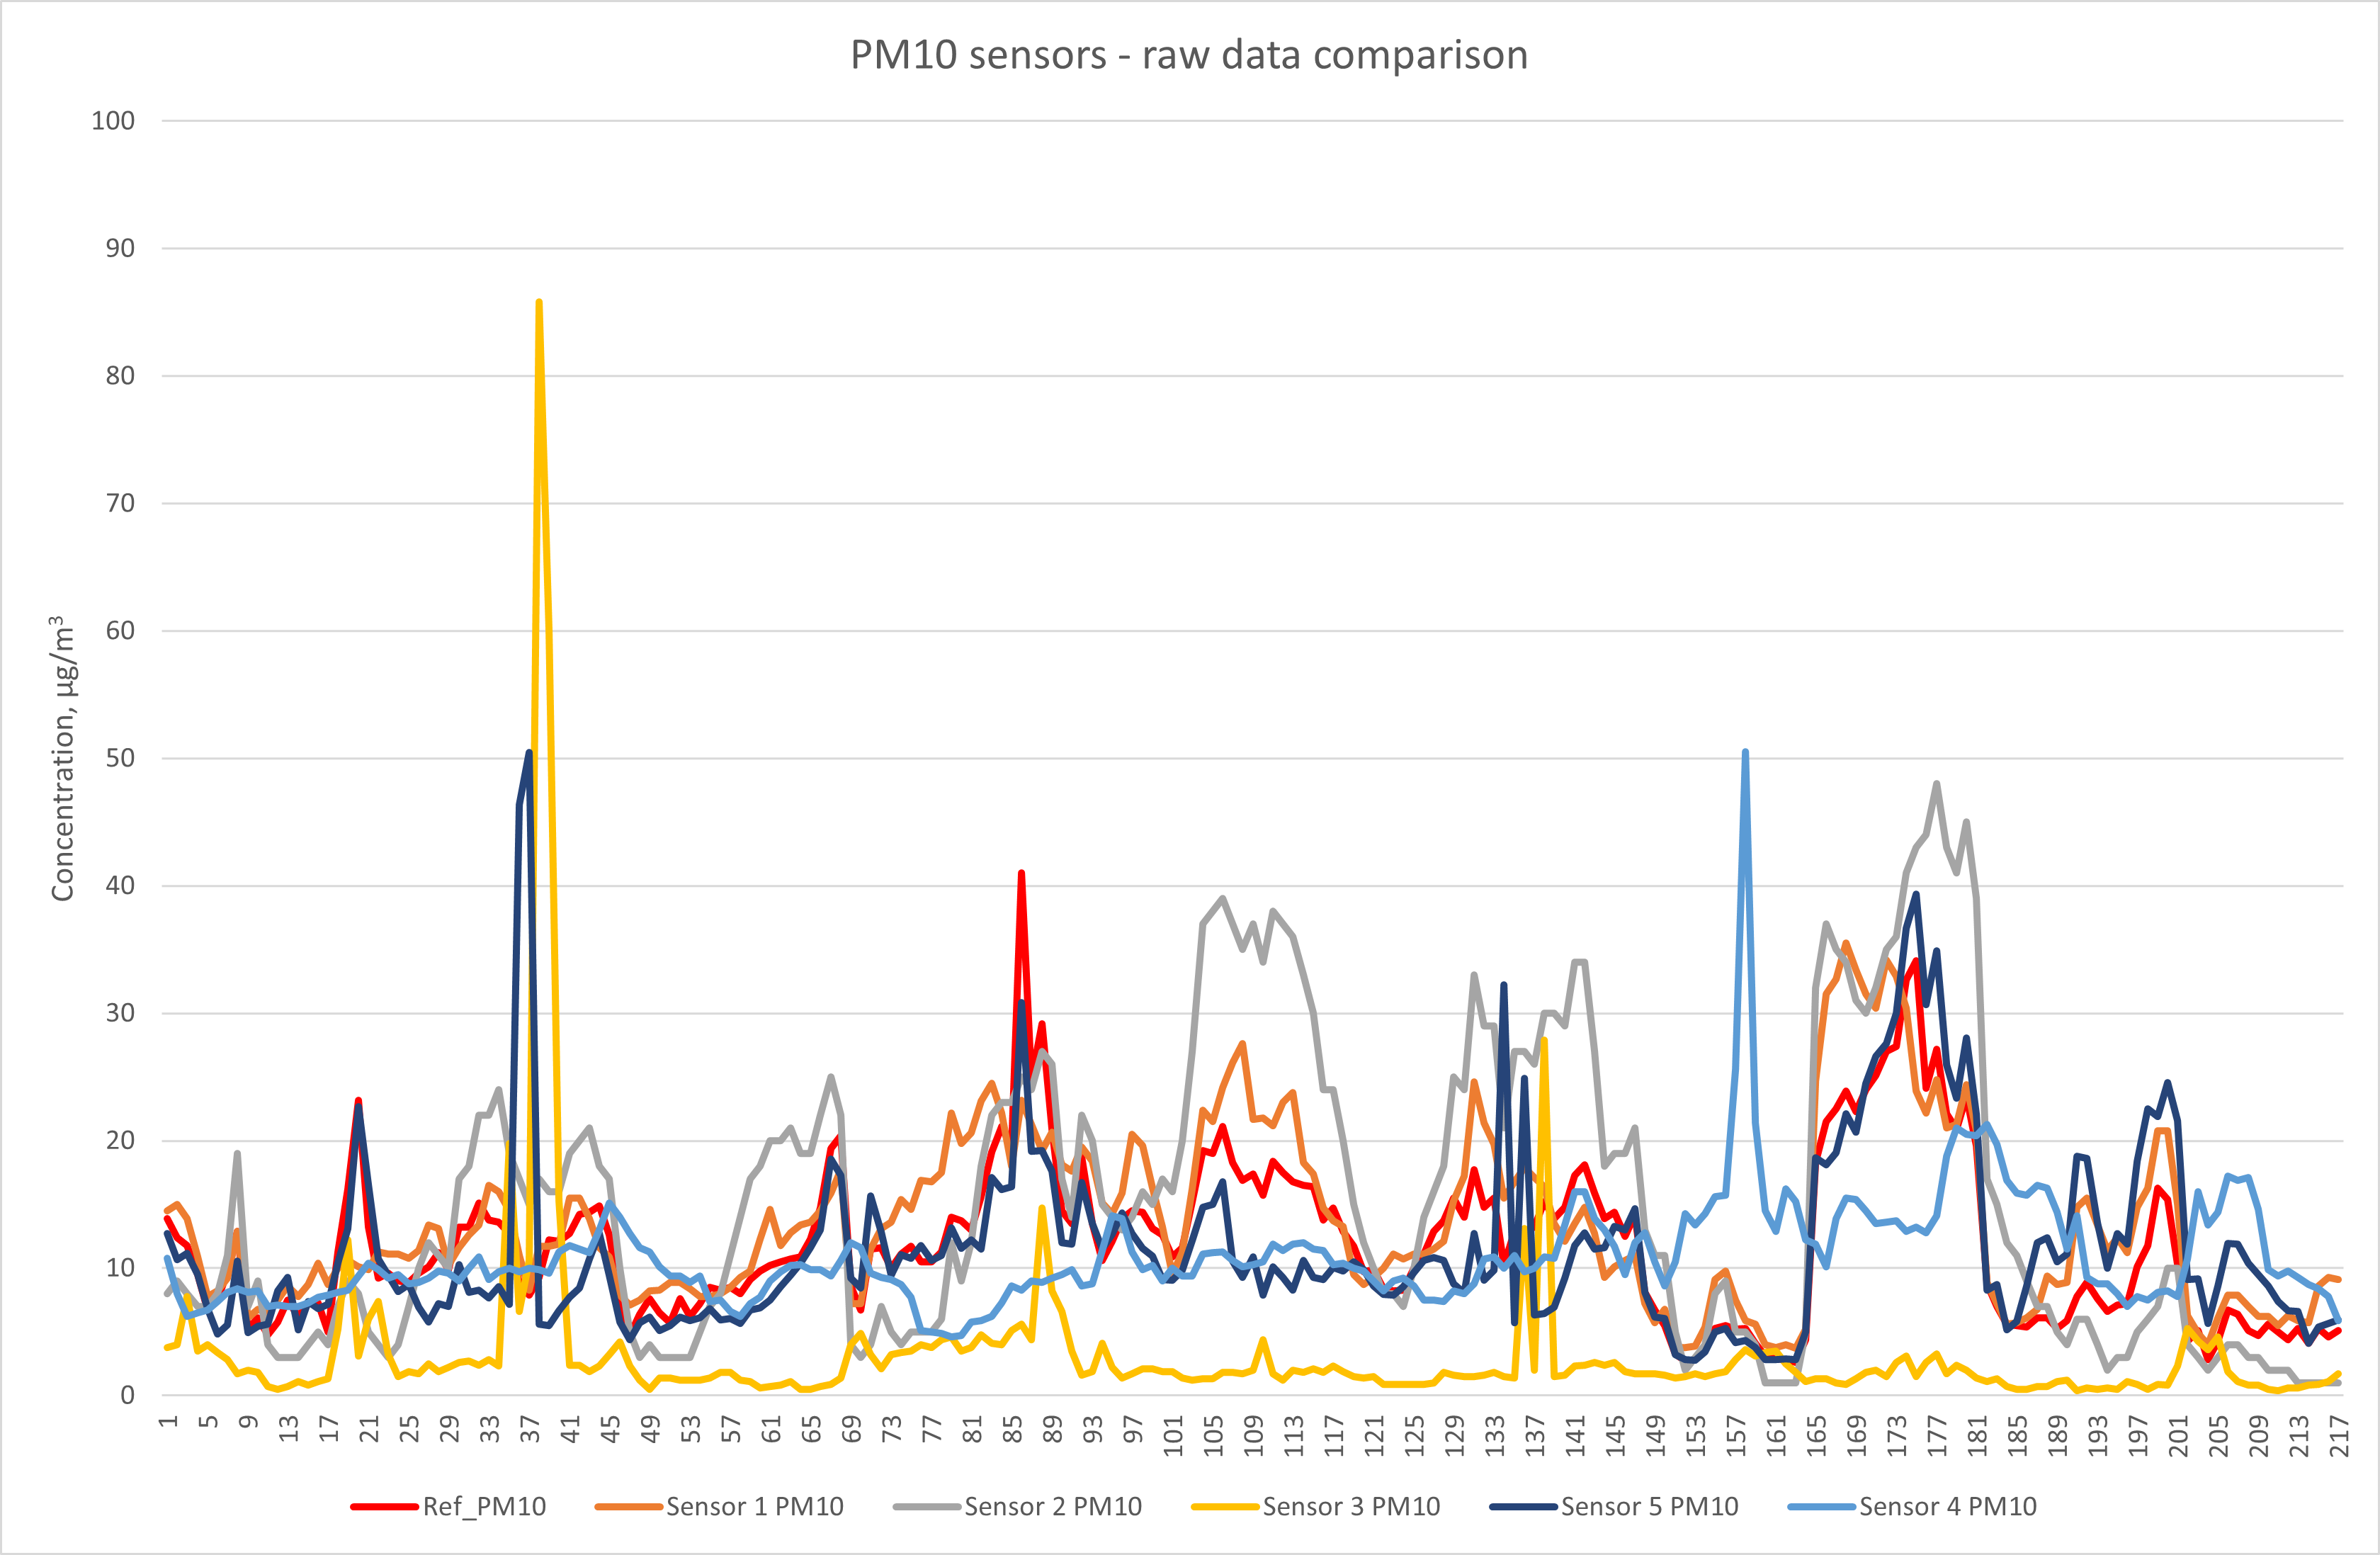
This raw data plot shows that PM10 sensors do not always perform as hoped. One system shows consistently good behaviour compared to the reference, three others are reasonably correlated most of the time, while one shows poor agreement. The statistical analysis of the time series data is presented below:
| Parameter | Uncertainty | R2 | Slope | Offset |
| Sensor 1 | 22.6 | 0.730 | 1.068 | 0.9 |
| Sensor 2 | 180.2 | 0.680 | 2.078 | -9.5 |
| Sensor 2 (slope / offset corrected) | 28.1 | 0.680 | 0.869 | 1.6 |
| Sensor 3 (outliers removed) | 172.8 | 0.027 | 0.113 | 1.3 |
| Sensor 4 (outliers removed) | 151.0 | 0.002 | 0.042 | 10.3 |
| Sensor 5 (outliers removed) | 16.6 | 0.650 | 0.992 | 0.0 |
Table 2 – summary of PM10 sensor performance (uncorrected unless stated)
Over the duration of this test, two of the PM10 systems provided measurement data that was usable (i.e. of acceptable uncertainty) without correction. One of these did, however, require the removal of spurious data spikes that occurred during periods of high humidity, a known problem with some sensor systems (and shown in the animated plot earlier). To summarise, in truth, only one system provided a completely intervention free dataset.
Another sensor system provided good data after application of slope and offset correction.
The PM10 data from the remaining two systems could not be corrected in any way to make the data comparable to the reference method.
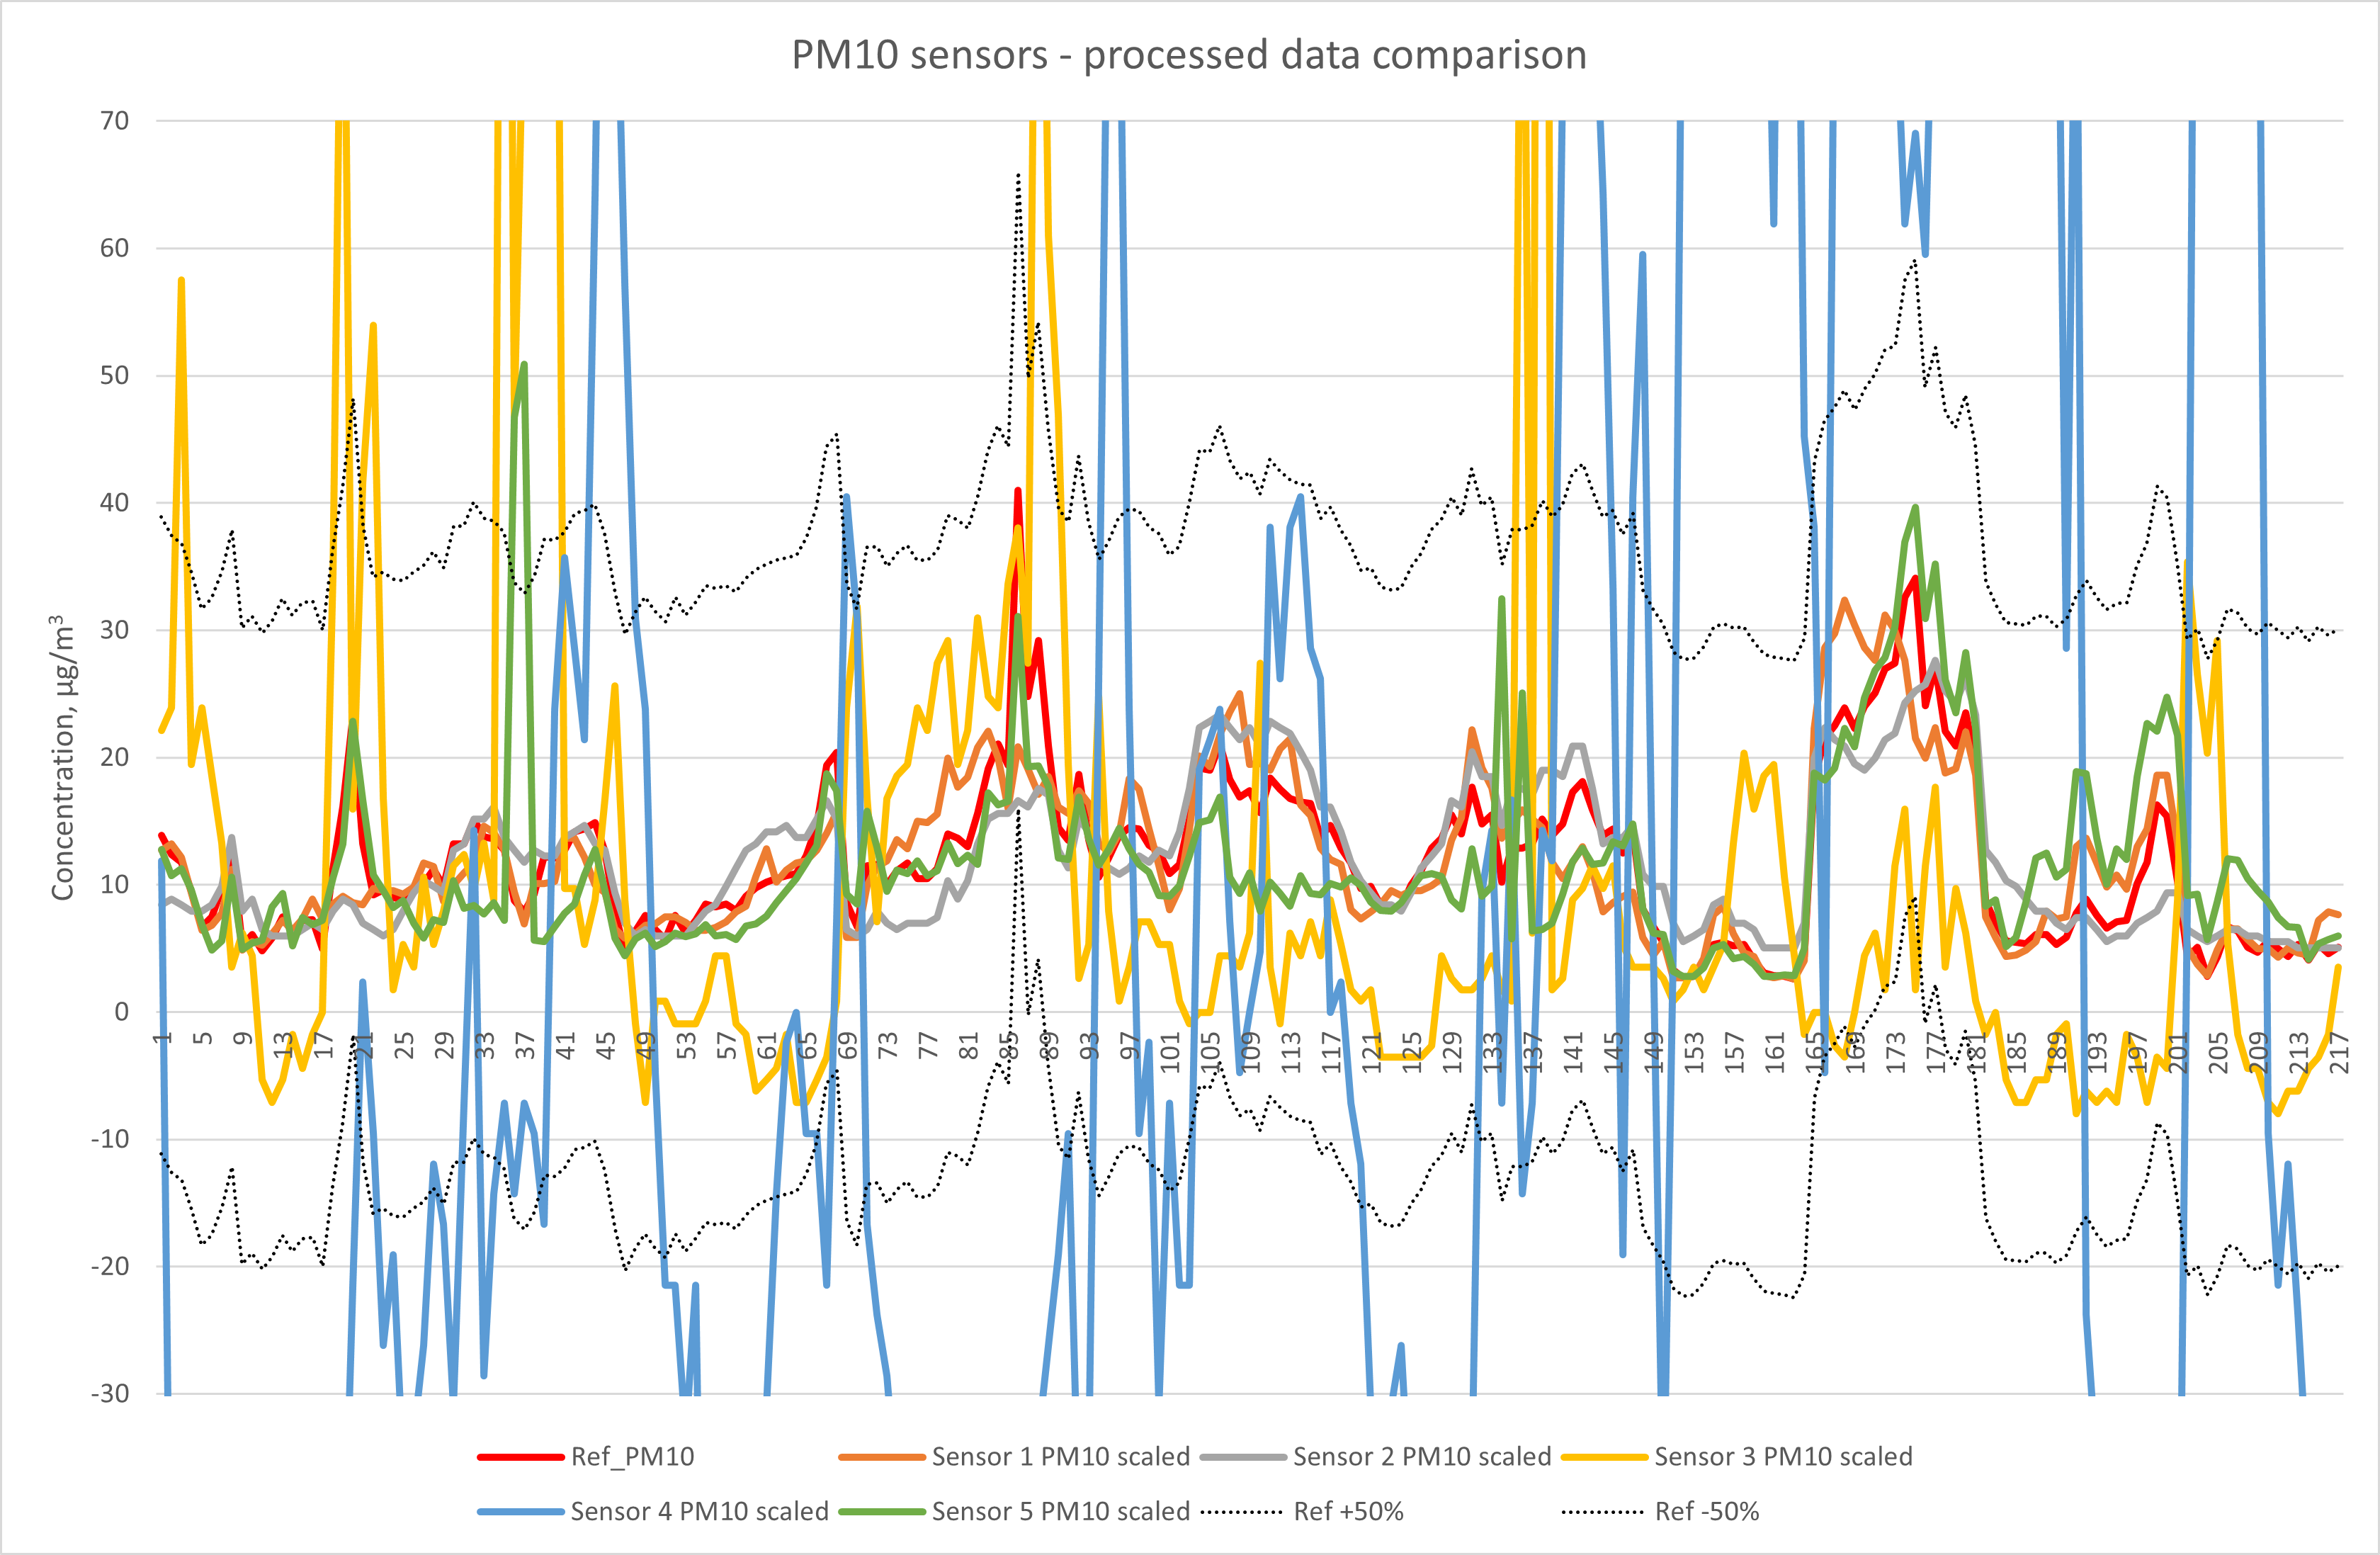
This plot shows that the processed data, corrected for slope and offset, from sensors 1, 2 and 5 is comfortably within the data quality objective for indicative data (50%) at the limit value (±25 µg/m3). Sensors 3 and 4 are not able to meet this requirement. For this observation to be valid in the long-term, these relationships need to be re-evaluated and corrected (where necessary) regularly.
PM2.5 Particulate Matter:
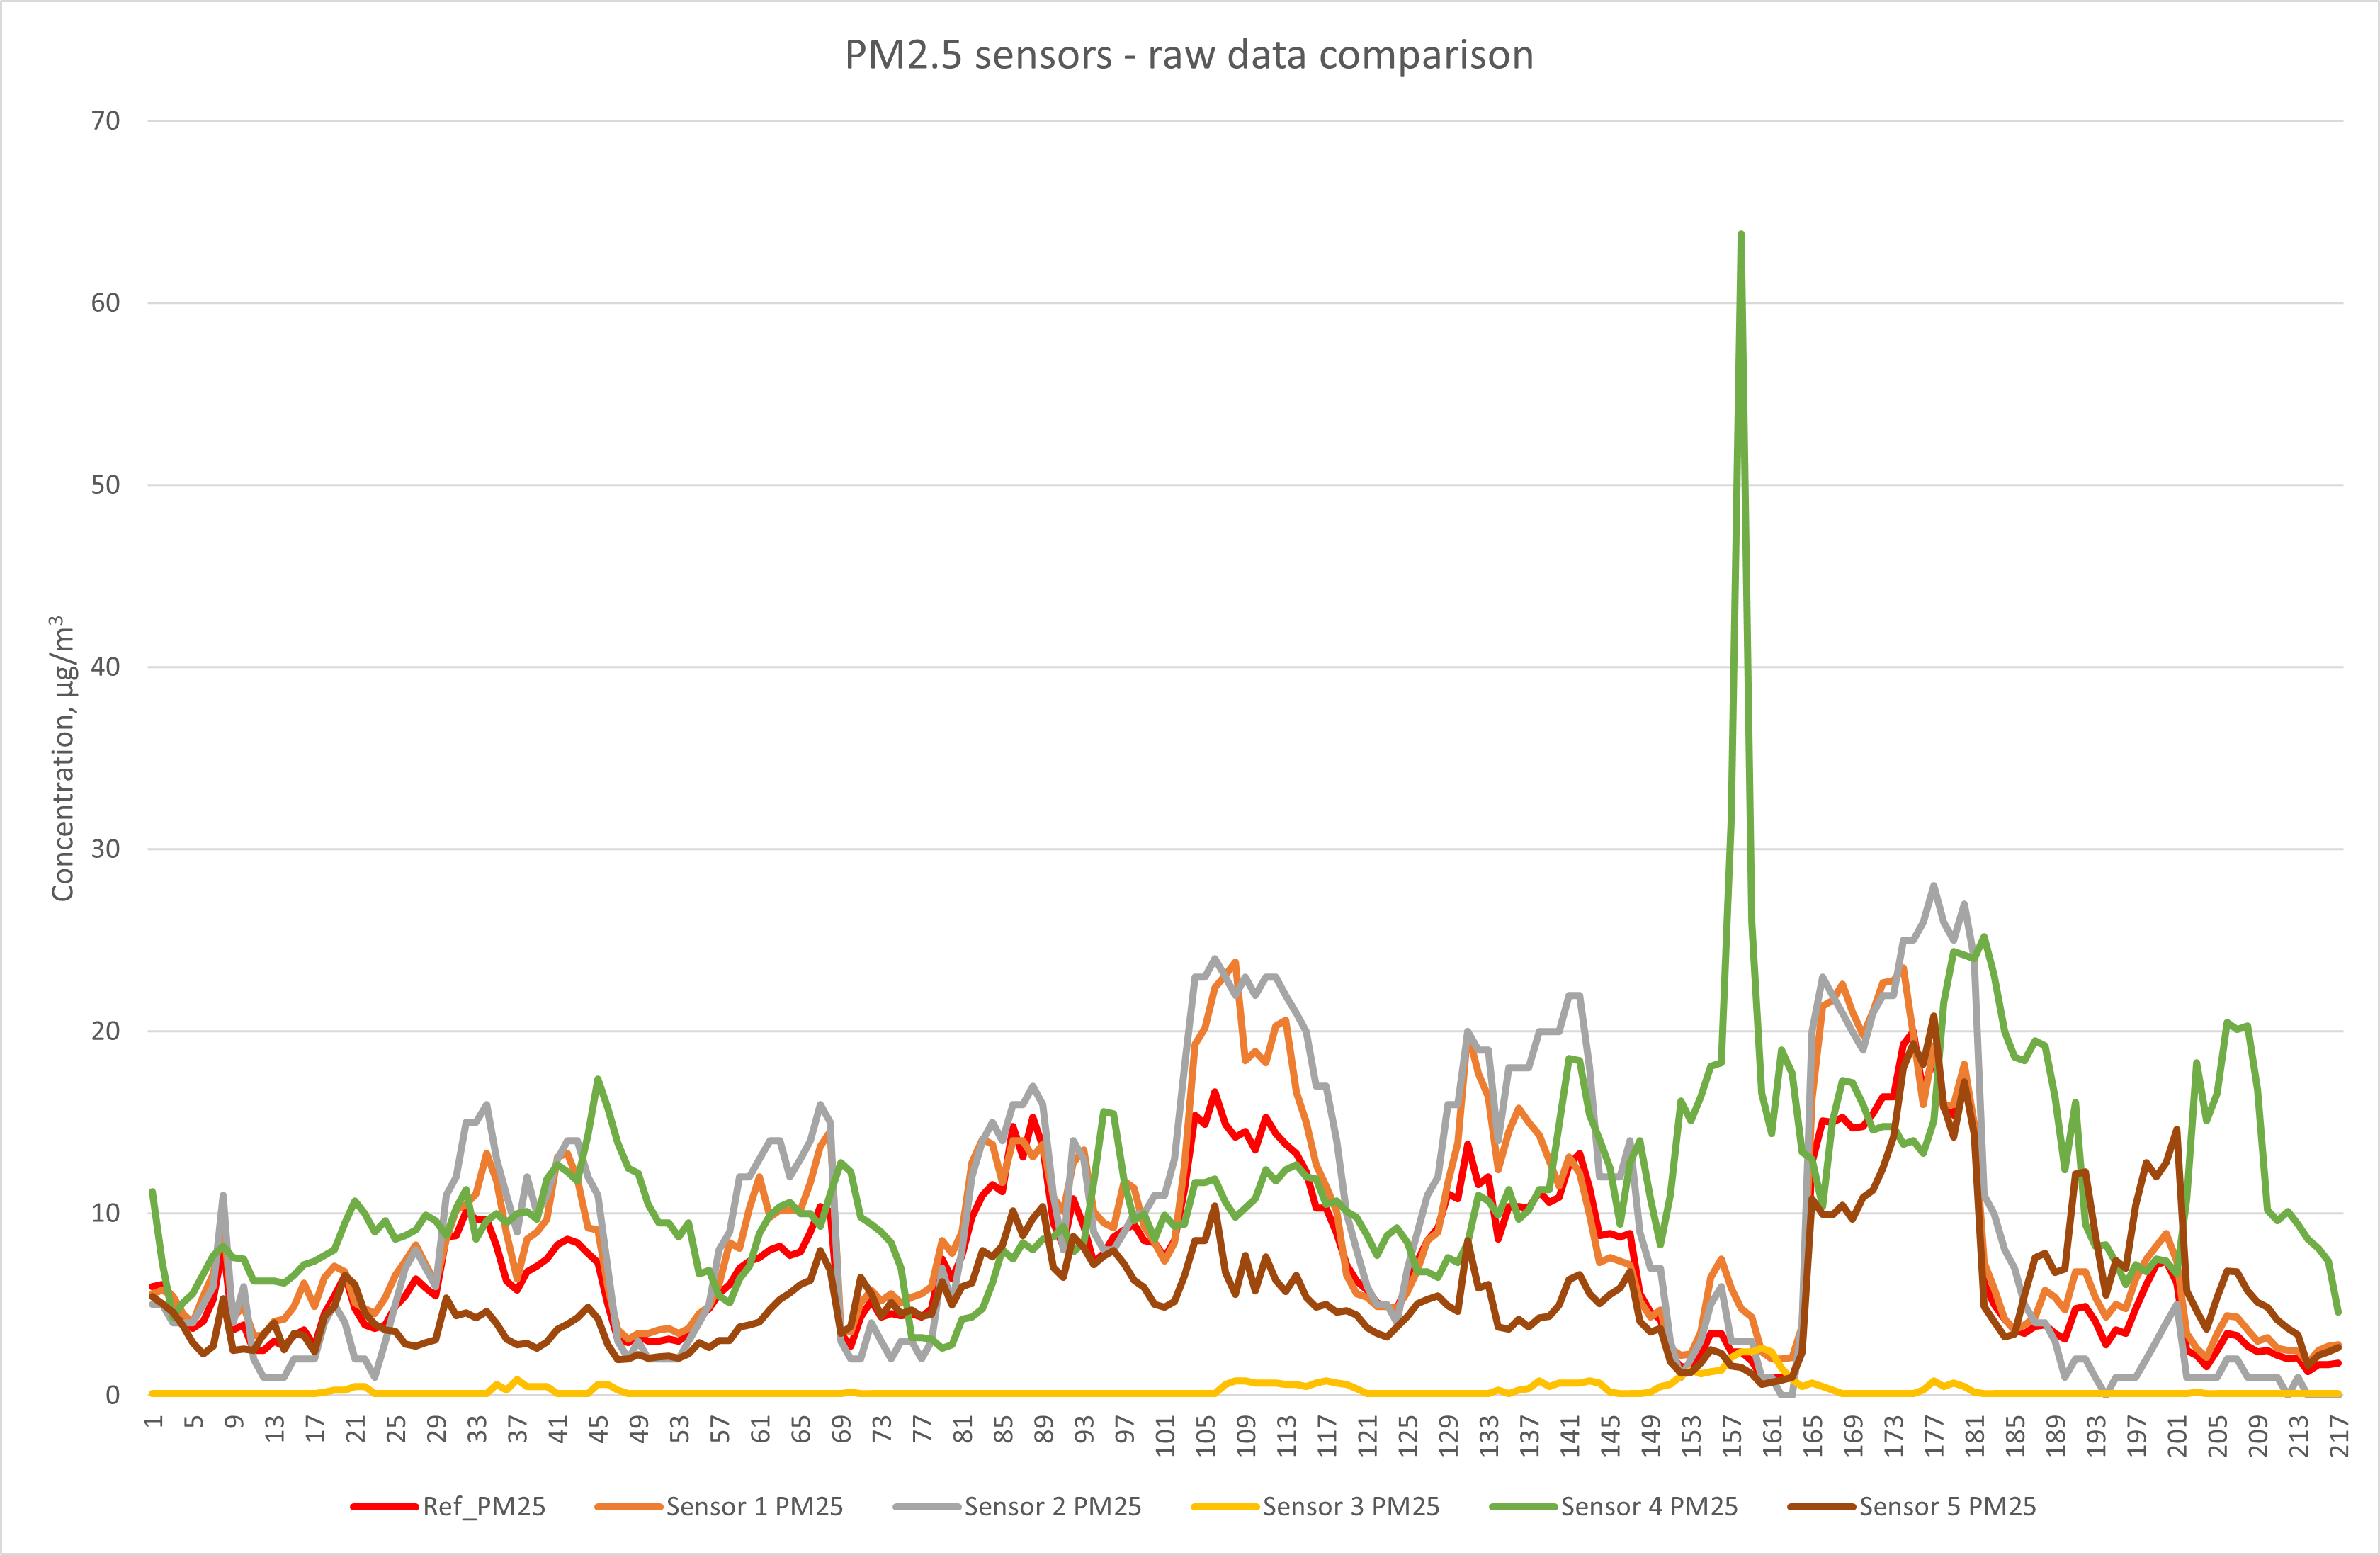
Sensor measurements of PM2.5 are usually affected less by humidity (compared to PM10), and this is reflected in the improved response profiles of some of the systems. Sensor 3 is still performing poorly compared to the others and sensor 4 shows a spike in response not mirrored by the others, or the reference method.
| Parameter | Uncertainty | R2 | Slope | Offset |
| Sensor 1 | 52.7 | 0.90 | 1.267 | -0.3 |
| Sensor 1 (slope corrected) | 10.0 | 0.90 | 0.988 | -0.1 |
| Sensor 2 | 130.1 | 0.92 | 1.758 | -3.3 |
| Sensor 2 (slope / offset corrected) | 10.5 | 0.92 | 0.978 | 0.2 |
| Sensor 3 | 102.6 | 0.04 | 0.271 | 6.8 |
| Sensor 4 (outliers removed) | 616.4 | 0.11 | 4.653 | -19.2 |
| Sensor 4 (slope / offset corrected, outliers removed) | 128.0 | 0.11 | 0.168 | 6.3 |
| Sensor 5 | 42.3 | 0.53 | 0.81 | 0.0 |
Table 3 – summary of PM2.5 sensor performance (uncorrected unless stated)
One of the sensors provides data that meets the data quality objective out of the box, while a second is very close to also meeting this requirement. Two systems could not meet the requirement, even after slope and offset correction.
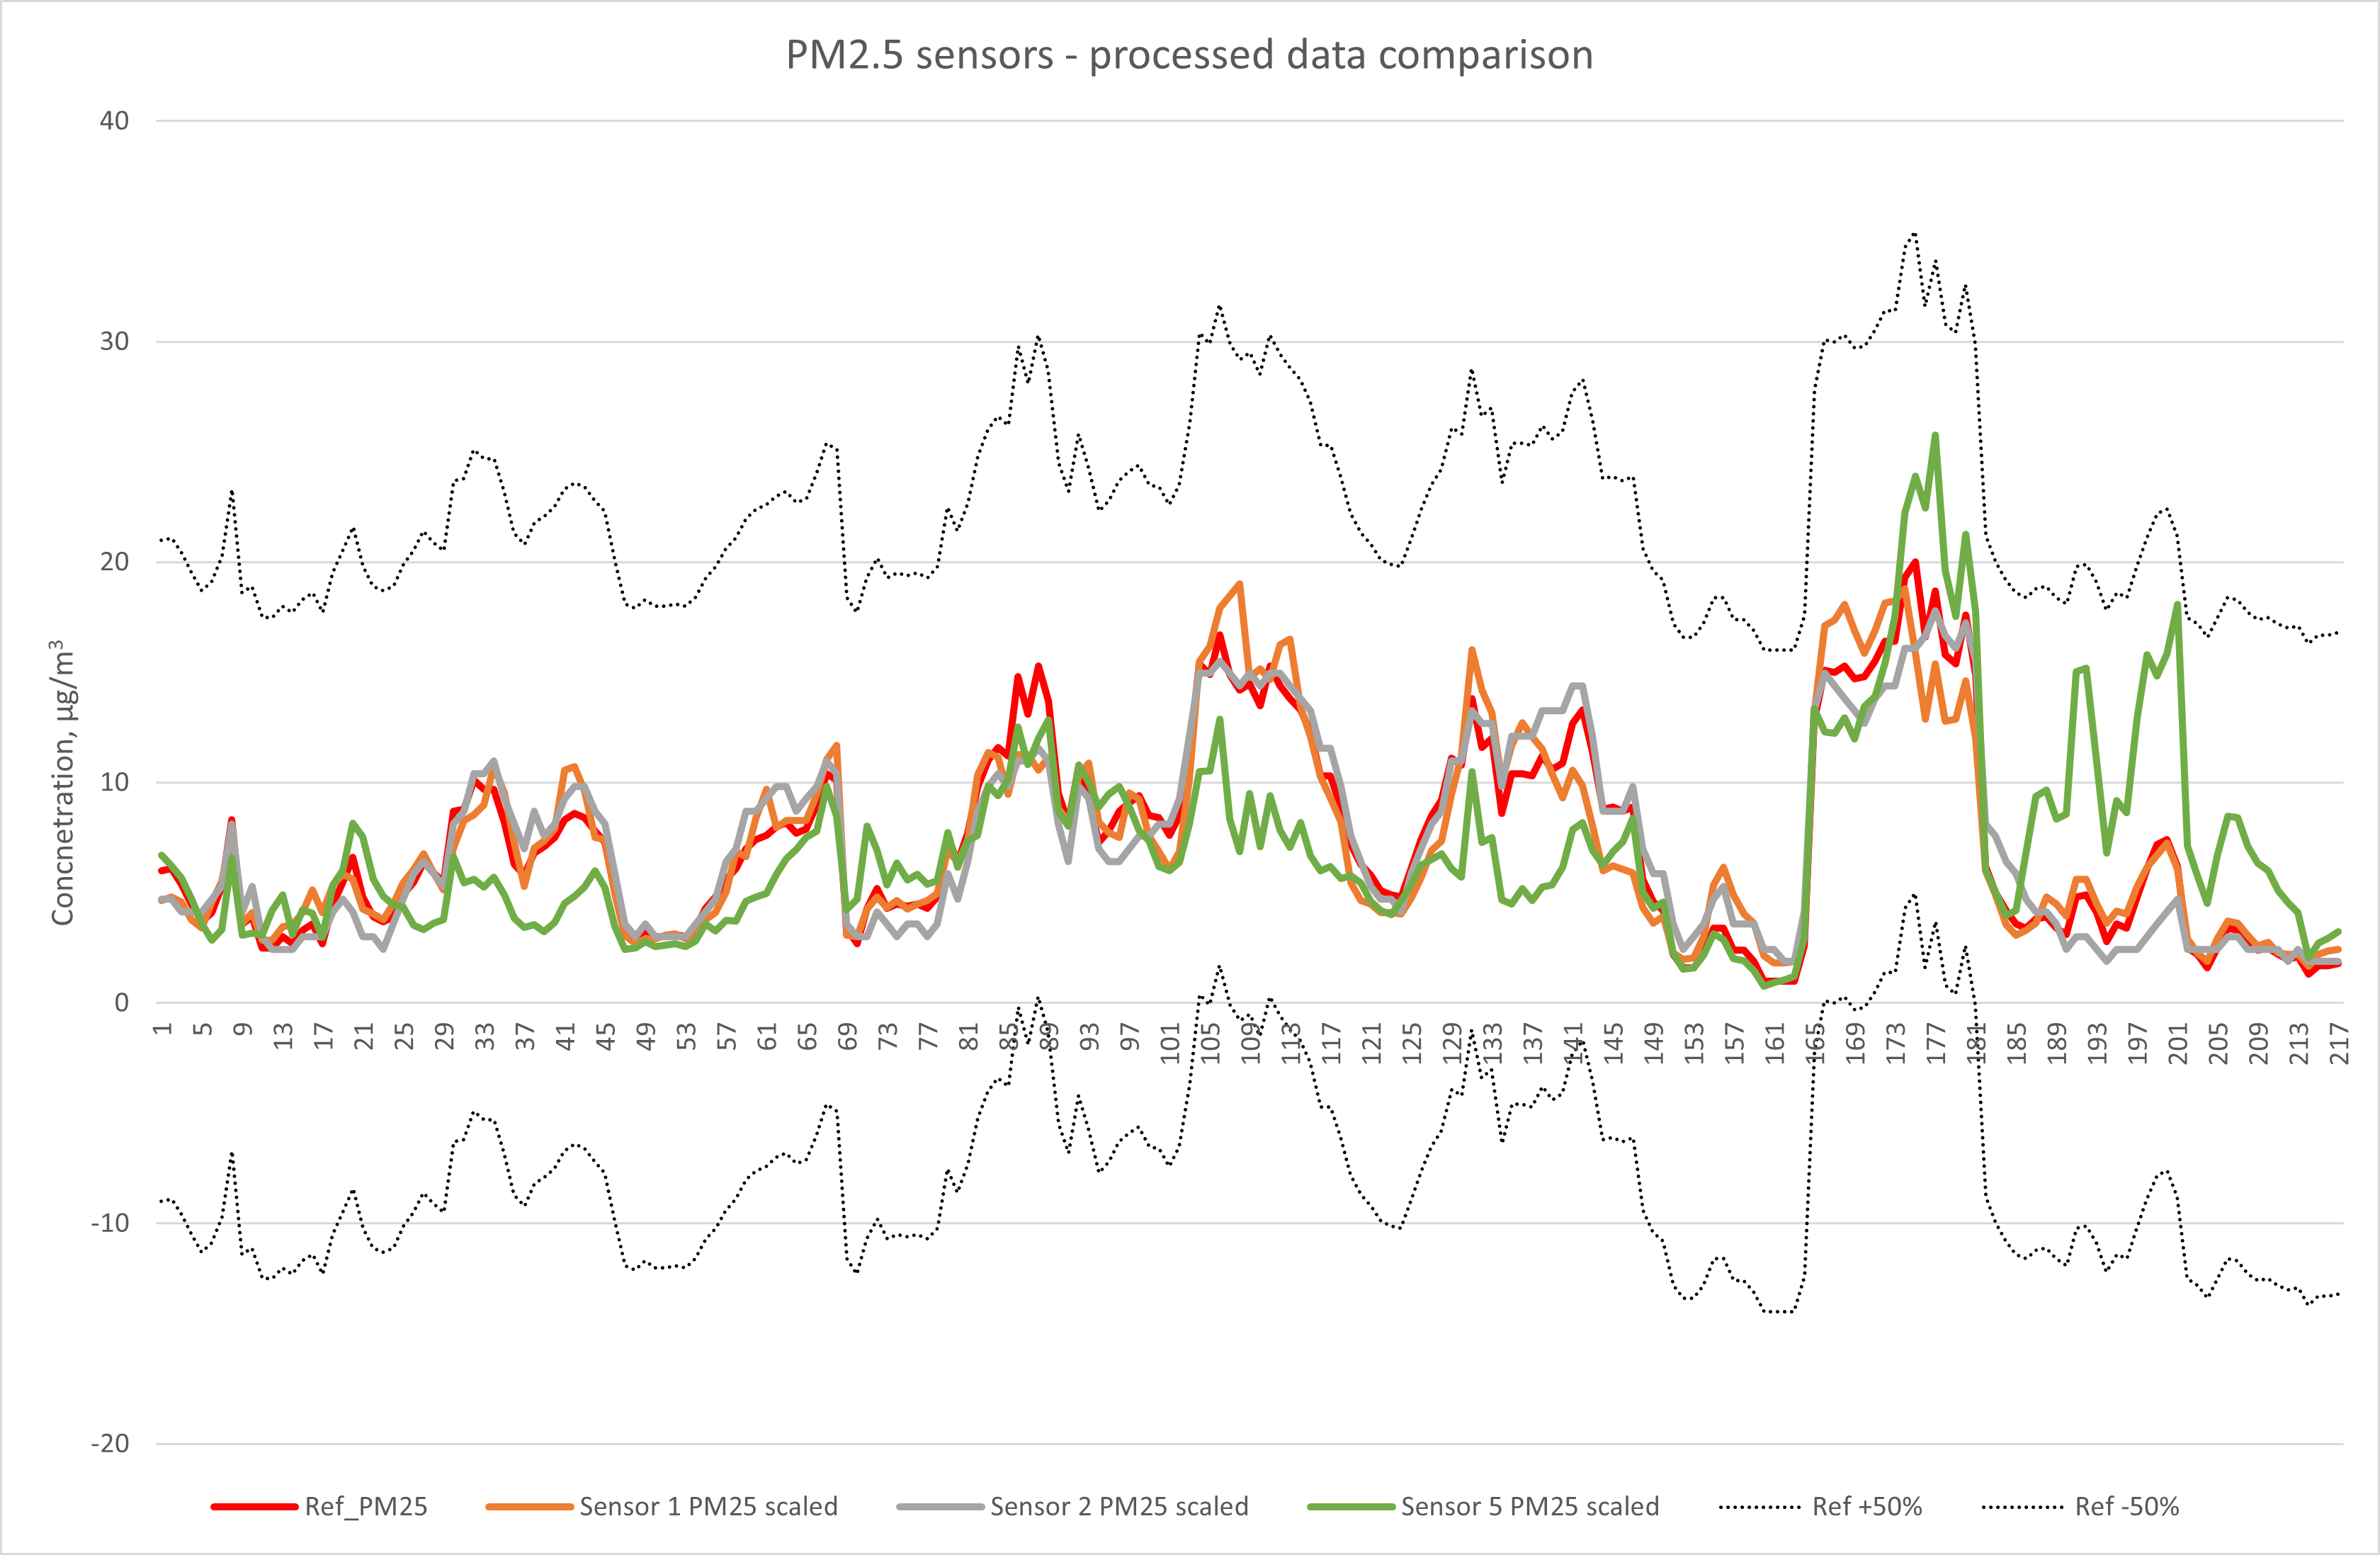
This plot shows that three of the five sensors, once corrected for slope and offset, show good agreement with the reference method, and comfortably meet the data quality objective for indicative measurements. For this observation to be valid in the long-term, these relationships need to be re-evaluated and corrected (where necessary) regularly.
The above demonstrates it is possible, at least for some systems in a short measurement period, to produce data that meets the indicative data quality objective status. However, further ongoing co-location, data scaling and analysis are needed to ensure that this remains true in the long-term. To do this also requires significant time and cost investment.
It is important to note that this study was undertaken at a background monitoring station, in autumn 2021, on the outskirts of London. It is extremely likely that the response profiles reported here will be different at a roadside or industrial location, and at different times of the year.
Performance of sensor systems need to be characterised at the intended location type and according to season to get a truer indication of system performance.
Is the conventional approach to QC our only option?
There is at least one additional possibility to explore for data processing. With enough evidence about how sensor systems perform, collectively, individually and with changing meteorology, it should be possible to build a system to consume the raw data and automatically predict corrected concentrations with improved confidence.
This is the point at which the distinction between measured and modelled data becomes blurred, but the question remains the same: How can I get the best value out of the data from sensor systems?
Ricardo’s air quality and data science teams have combined their expertise to tackle this question, and our research looks promising. For several sensor systems, we have successfully determined how to carry out more automated processing of raw sensor system measurements and can now apply this approach to deliver more automated, reliable data for live high-density sensor networks.
The aim of this work is to implement an online, real-time data processing system that will take measurements from any sensor system and process the outputs to produce data that meets the requirements of indicative status. We expect to offer this as a service later in 2022.
A number of manufacturers already claim that their raw data is automatically processed “in the cloud” to meet the requirements of indicative data quality objectives (DQOs). We continue to work with these suppliers to evaluate the performance of their systems, and advocate access to the “raw” measured data in a real-world situation to allow us to provide a fully informed view of their approach.
Summary
This brief opportunity to compare several sensor systems highlights a number of key takeaways:
- There is considerable variability in the observed performance of sensors, and it isn’t necessarily price-related.
- Very few systems are truly ‘plug and play’.
- The data the systems provide is often not good enough to be indicative. Sometimes, even after correction for slope and offset the indicative data quality objective is still not achieved.
- Agreement between duplicate sensor systems is usually good, showing that comparisons between identical systems is valid for looking at concentration gradients.
- Currently, the amount of effort required in undertaking QC for sensors is comparable to what is required for conventional automatic analysers
- Alternative, more automated data processing approaches are in development. These still need to be proven to provide processed data that meets indicative status or deals adequately with variations in location and season.
Could your organisation benefit from sensor data correction?
Ricardo routinely provides sensor manufacturers and users with technical evaluation, guidance and development support in terms of dataset management, quality assurance and quality control (QA/QC) and processing. For more information, visit our Air Quality Measurements page.
For direct queries or to discuss how Ricardo could help your organisation improve the quality of its sensor data reporting, get in touch using the link below

Brian Stacey
Related insights

01 Jun 2022