Follow Ricardo plc for regular updates
SHARE


Often when I present our vehicle emission results, I joke that we have such comprehensive data on vehicle characteristics, we even have the vehicle colour. This boast is well-founded – we have getting on for 100 different fields of information on the vehicles we measure and the database holds real-world emissions information on over 300,000 individual vehicles.
When gathering measurements, we are mostly interested in understanding how emissions vary with technical characteristics such as the fuel type, engine size and Euro classification. However, the data set collected is far more detailed in providing us with other information such as the dimensions of a vehicle, its mass, number of doors, engine power, number of valves in the engine and various environmental parameters (e.g. ambient temperature and road gradient) at the time and location of our measurements. Oh, and of course, vehicle colour.
Recently, a colleague asked me ‘Do the emissions from cars depend on their colour?’ I was going to reply – ‘I have a lot on, I’ll get back to you’. But being curious, I thought I would look into it.
For this analysis, I focused on Euro 6 diesel cars as an example. Selecting emissions data where we have at least 100 measurements for each colour provides about 30,000 measurements – so a decent sample size.
A plot of the average emission by vehicle colour is shown in Figure 1.
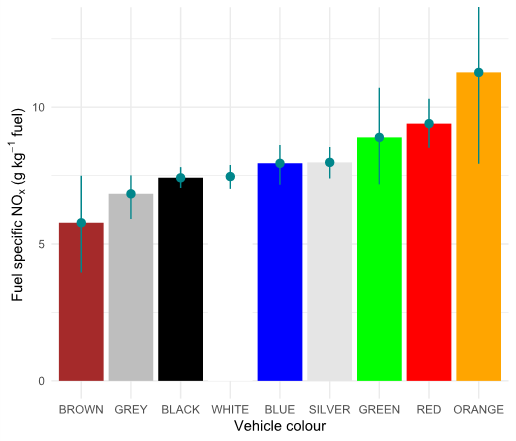
Figure 1: Emissions of NOx as a function of vehicle colour for Euro 6 diesel passenger cars. The error bars show the 95% confidence interval in the mean emission.
Much to my surprise, the graph seems to suggest green, red and orange cars have higher emissions of NOx.
Despite the seeming absurdity of such a link, there are myriad reasons why this might be the case. For example, there could be certain manufacturers that produce more orange cars and these have particular engine types. Each of these car model types would have its own emission characteristics and we are simply seeing these effects in the data. It would be difficult to work out the potential reasons for differences without more information.
However, when we make our real-world emissions measurements, we also measure the vehicle speed using lasers for accuracy – so it is interesting to look at that data as a measure of driver behaviour too. This data is shown in Figure 2.
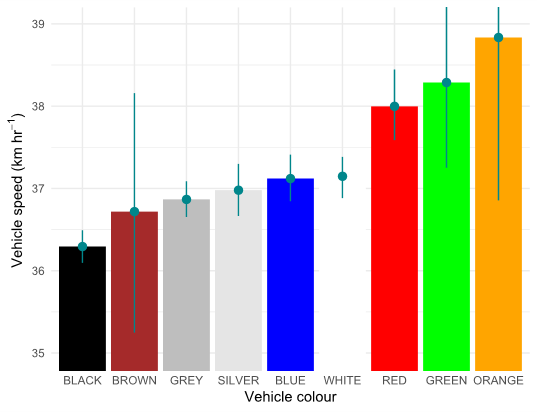
Figure 2: Vehicle colour as a function of vehicle speed for Euro 6 diesel passenger cars. The error bars show the 95% confidence interval in the mean vehicle speed.
Astonishingly, the above graph shows that red, green and orange cars tend to drive through our remote sensing light beams faster than other colours!
The broad ordering of emissions of NOx is similar to that for vehicle speed. Black, brown and grey cars seem to travel past our measurement sites at slower speeds than red, green and orange cars. The data we have is representative of a wide range of driving conditions and locations across the UK – so there is no bias (e.g. in measuring more orange vehicles at one particular location where vehicle speeds might be higher).
While we probably won’t be submitting this analysis for publication in ‘Nature’, it is intriguing…
Could it be the case that drivers of certain colour cars drive differently? For example, are drivers of red cars a bit more ‘lead-footed’?
The other aspect of this analysis is that it shows the power of large sample sizes for investigating vehicle emissions. With such large data sets, it becomes possible to quantify effects that would otherwise be difficult, such as the effect of ambient temperature and road gradient.
The colour of the vehicle is not the only possible variable that could be affected by driver behaviour. It seems that petrol and diesel hybrids, and fully electric vehicles also tend to drive more slowly than conventional petrol and diesel cars, as shown in Figure 3.
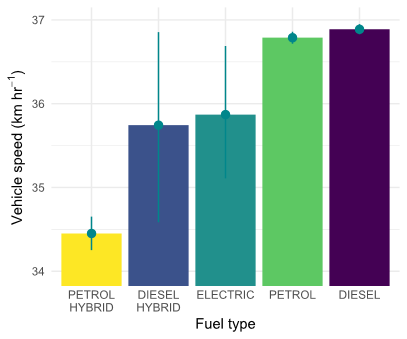
Figure 3: Fuel type as a function of vehicle speed for Euro 5 and 6 passenger cars. The error bars show the 95% confidence interval in the mean vehicle speed.
Indeed, petrol and diesel cars essentially travel at the same speed.
The contrast in fuel or propulsion type is particularly noticeable for hybrid petrol cars where we have a lot of measurements relative to conventional petrol and diesel. This finding seems intuitively reasonable in that those who choose hybrid vehicles are perhaps not minded to drive like Lewis Hamilton.

David Carslaw